Dauguma rizikos sistemų yra pažeistos. Jos remiasi tik spalvotomis matricomis ir nuojautomis, o jūsų verslas pražudo milijonus nesėkmingų projektų.
Kūrėme rizikos sistemas "Fortune 500" bendrovėms ir matėme tą patį pavyzdį: komandos kuria gražias, įspūdingai atrodančias informacines lenteles, tačiau negali atsakyti į vienintelį svarbų klausimą: "Kokia reali tikimybė, kad šis projektas bus sėkmingas?"
Problema nėra jūsų komandos kompetencija. Problema ta, kad tradicinis rizikos valdymas neapibrėžtumą traktuoja kaip statišką skaičių, nors iš tikrųjų jis yra gyvas, kvėpuojantis žvėris, kuris didėja per visą projekto gyvavimo ciklą.
Šiame vadove parodoma, kaip "Power BI" programoje sukurti iš tikrųjų veikiančią kiekybinės rizikos sistemą. Jokios teorijos. Jokių pūstų žodžių. Tik trys pagrindiniai komponentai, skiriantys įmones, kurios projektus įgyvendina laiku ir pagal biudžetą, nuo tų, kurios jų neįgyvendina.
Tradicinio rizikos valdymo problema
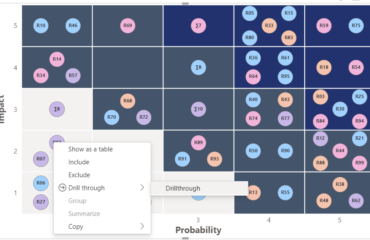
Atėję į bet kurį projekto susirinkimą pamatysite tą patį teatrą: raudonus, geltonus ir žalius taškus, išsibarsčiusius rizikos registre. Paklauskite, ką iš tikrųjų reiškia "vidutinė rizika", vertinant ją doleriais ir poveikiu terminams, ir sulauksite tuščių žvilgsnių.
Štai kas yra negerai taikant šį požiūrį:
- Jokio matematinio pagrindo: "Didelė rizika" skirtingiems žmonėms reiškia skirtingus dalykus
- Statiškas mąstymas: Rizika didėja ir sąveikauja tarpusavyje, tačiau daugumoje sistemų ji traktuojama kaip pavieniai įvykiai.
- Nėra duomenų linijos: Negalite atsekti, kaip buvo padarytos išvados, ir patvirtinti jų tikslumo.
- Rankinis valdymas: Rizikos peržiūra atliekama susitikimuose, o ne koduose
Rezultatas? Projektai, kurie atrodo "žali", kol staiga tampa "žaliais". Tuomet jau būna per vėlu koreguoti kursą.
Mums reikėjo kitokio požiūrio. Tokio, kuris kiekybiškai įvertintų riziką realiais skaičiais, stebėtų, kaip neapibrėžtumas sklinda per projekto priklausomybes, ir automatizuotų valdymą, kad problemos išryškėtų anksčiau, nei virsta katastrofomis.
1 komponentas: Neapibrėžtumo sklaida - rizikos matematikos taikymas
Neapibrėžtumo sklaida skamba sudėtingai, tačiau koncepcija paprasta: kai neapibrėžti dalykai sudedami vienas ant kito, bendras neapibrėžtumas didėja nuspėjamu būdu.
Pagalvokite apie tai taip: Jei A užduotis trunka 5-10 dienų, o B - 3-7 dienas, bendras laikas nėra 8-17 dienų. Matematiniai skaičiavimai yra sudėtingesni dėl to, kaip derinami tikimybių pasiskirstymai.
Štai kaip tai įgyvendiname "Power BI":
1 žingsnis: apibrėžkite tikimybių skirstinius
Užuot sakę "Užduotis A yra vidutinės rizikos", apibrėžiame ją kaip tikimybių pasiskirstymą. Paprastai naudojame trijų taškų įverčius (optimistinį, labiausiai tikėtiną, pesimistinį), kad sukurtume beta pasiskirstymą.
Programoje "Power BI" sukurkite apskaičiuotus stulpelius:
- Optimistinis scenarijus (10 procentilis)
- Labiausiai tikėtinas scenarijus (režimas)
- Pesimistinis scenarijus (90-oji procentilė)
2 veiksmas: sukurti sklaidos logiką
Kurkite DAX priemones, kurios matematiškai sujungia pasiskirstymus. Nepriklausomoms užduotims iš eilės:
- Bendras vidurkis = atskirų vidurkių suma
- Bendras nuokrypis = atskirų nuokrypių suma
- Bendras standartinis nuokrypis = kvadratinė šaknis iš bendro nuokrypio
Koreliuotai rizikai apskaičiuoti pridėkite koreliacijos koeficientus, kad pakoreguotumėte skaičiavimus.
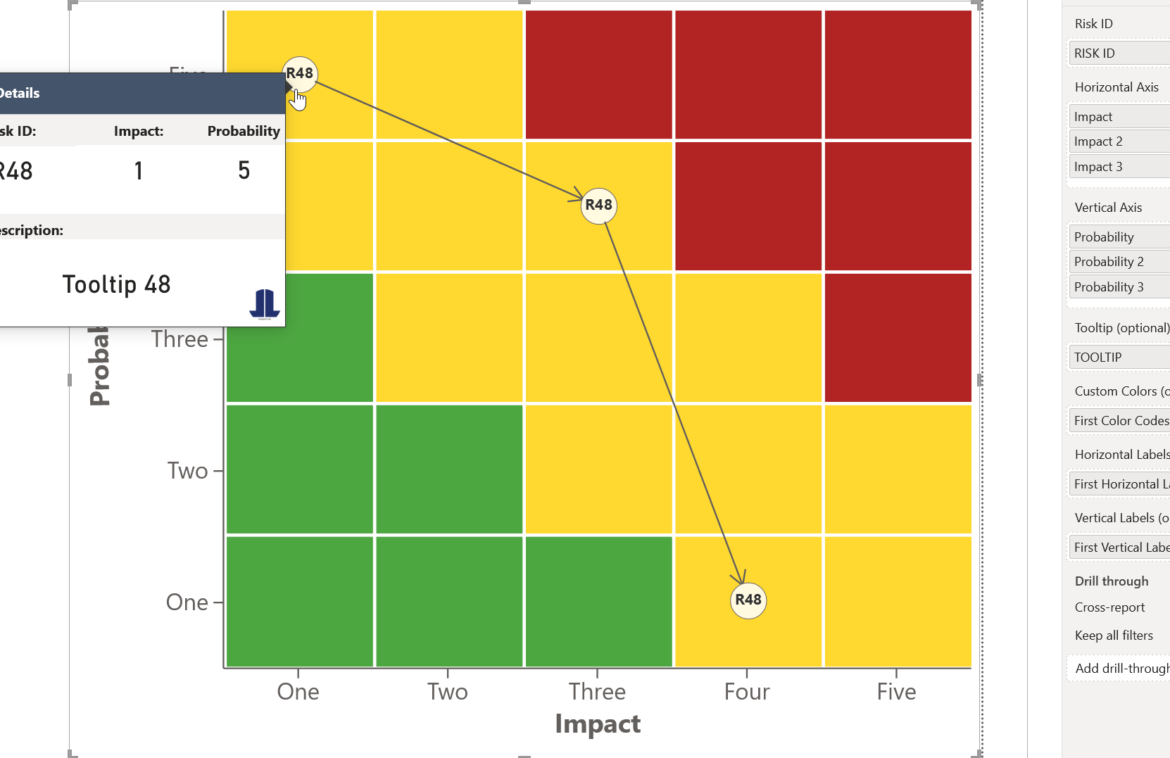
3 žingsnis: vizualizuokite neapibrėžtumo intervalus
Naudokite "Power BI" paklaidų juostas ir pasikliautinojo intervalo diagramas, kad parodytumėte ne taškinius įverčius, o tikimybių intervalus. Suinteresuotosios šalys turi matyti, kad "3 mėnesiai" iš tikrųjų reiškia "nuo 2,1 iki 4,2 mėnesio su 80% patikimumu".
Šis metodas pakeitė vieno kliento $50M infrastruktūros projekto valdymą. Užuot nustačius biudžeto viršijimą, kai projektas buvo baigtas 60%, jie nustatė didelio kintamumo sąnaudų centrus, kai projektas buvo baigtas 15%, ir ėmėsi taisomųjų veiksmų.
2 komponentas: "Lineage Trust Scores" - žinojimas, kuo galite tikėti
Ne visi duomenys yra vienodi. Labiausiai patyrusio inžinieriaus parengta išlaidų sąmata yra svarbesnė nei jaunesniojo analitiko, kuris remiasi pasenusiomis prielaidomis.
Linijos patikimumo balai kiekybiškai įvertina duomenų patikimumą, kad galėtumėte atitinkamai įvertinti savo rizikos skaičiavimus.
Kaip veikia pasitikėjimo balai
Skaitmeninius balus (0-1 skalė) skiriame remdamiesi keturiais veiksniais:
- Šaltinio patikimumas: Sąmatą teikiančio asmens ar sistemos veiklos istorija
- Duomenų šviežumas: Kiek nauja yra pagrindinė informacija
- Metodo kokybė: Ar tai buvo neapgalvotas spėjimas, ar paremtas istorine analize
- Patvirtinimo lygis: Kiek nepriklausomų patikrinimų šie duomenys praėjo
Įgyvendinimas "Power BI
Sukurkite duomenų kokybės lentelę, kurioje stebima:
- Duomenų šaltinio ID
- Paskutinio atnaujinimo laiko žyma
- Taikytas metodas (paieškos lentelė su balais)
- Patvirtinimų skaičius
- Šaltinio kompetencijos lygis
Sukurkite apskaičiuotą stulpelį, kuriame šie veiksniai sujungiami į sudėtinį pasitikėjimo balą:
Pasitikėjimo balas = (šaltinio svoris * metodo svoris * šviežumo svoris * patvirtinimo svoris) / 4
Pasitikėjimo balų naudojimas apskaičiuojant riziką
Įvertinkite neapibrėžtumo intervalus pagal pasitikėjimo balus. Mažo patikimumo įverčiams suteikiami platesni pasikliautinieji intervalai. Didelio pasitikėjimo įverčiai yra glaudesni.
Taip išvengiama daugumos analitikos projektų žlugdymo problemos "šiukšlės į šiukšlyną" ir "šiukšlės iš šiukšlyno". Jūs ne tik skaičiuojate riziką - jūs skaičiuojate riziką remdamiesi tuo, kiek turėtumėte pasitikėti savo įvesties duomenimis.
Vienas gamybos klientas, pasinaudojęs šiuo metodu, nustatė, kad jo "mažos rizikos" tiekėjų vertinimai buvo pagrįsti dvejų metų senumo finansiniais duomenimis. Atnaujinus analizę naujausiais duomenimis, trys "žalieji" tiekėjai tapo "raudonaisiais" - likus dviem savaitėms iki didelio tiekimo grandinės sutrikimo.
3 komponentas: valdymas kaip kodas - saugos tinklo automatizavimas
Rankinis valdymas nėra pritaikomas ir yra nenuoseklus. Tai, kas bus pažymėta kaip rizika, priklauso nuo to, kas turi gerą dieną ir kas nepamiršta patikrinti.
Valdymas kaip kodas automatizuoja rizikos aptikimą ir eskalavimą naudojant iš anksto nustatytas taisykles, kurios paleidžiamos kiekvieną kartą atnaujinus duomenis.
Automatinių rizikos taisyklių kūrimas
Apibrėžkite rizikos ribas kaip DAX priemones, o ne kaip kietai užkoduotas vertes. Pavyzdžiai:
- Biudžeto nuokrypis viršija 15% patvirtintos sumos
- Tvarkaraščio patikimumas sumažėja žemiau 70%
- Bet kurios kritinio kelio užduoties pasitikėjimo rodiklis yra mažesnis nei 0,6
- Trys ar daugiau prielaidų nebuvo patvirtintos per 30 dienų
Eskalavimo logika
Sukurkite apskaičiuotus stulpelius, kurie sukelia skirtingus atsako lygius:
- Žalia spalva: Visos ribos pasiektos, veiksmų imtis nereikia
- Geltonos spalvos: Pažeista viena riba, sustiprinkite stebėseną
- Raudona spalva: Pažeistos kelios ribos, būtina nedelsiant atlikti peržiūrą
Integracija su "Power Automate
Prijunkite valdymo taisykles prie "Power Automate" srautų, kurie:
- Siųskite automatinius įspėjimus, kai pažeidžiamos ribos
- Kurti užduotis projektų valdymo sistemose
- Numatyti peržiūros susitikimus su atitinkamomis suinteresuotosiomis šalimis
- rengti išimčių ataskaitas vyresniajai vadovybei
Audito seka
Registruokite kiekvieną valdymo veiksmą, nurodydami laiko žymes, paleidimo sąlygas ir atliktus atsakymus. Taip sukuriama audito seka, kuri yra būtina nuolatiniam tobulėjimui ir atitikties teisės aktų reikalavimams užtikrinimui.
Statybų klientas įgyvendino šį metodą ir per šešis mėnesius sumažino vidutinį projekto viršijimą nuo 23% iki 8%. Sistema automatiškai užfiksavo apimties didėjimą ir išteklių konfliktus, užuot pasikliovus, kad projekto vadovai problemas nustatys rankiniu būdu.
Integracijos strategija: Komponentų suderinimas
Šios trys sudedamosios dalys yra galingos kiekviena atskirai, tačiau tinkamai integruotos keičia situaciją.
Duomenų srauto architektūra
Sukurkite "Power BI" modelio struktūrą su aiškiu duomenų eiliškumu:
- Šaltinio sluoksnis: Neapdoroti projekto duomenys su pasitikėjimo balų metaduomenimis
- Skaičiavimo sluoksnis: Neapibrėžtumo sklaida ir rizikos kiekybinis įvertinimas
- Valdymo lygmuo: Automatinis taisyklių vertinimas ir išimčių žymėjimas
- Pristatymo sluoksnis: Įvairių suinteresuotųjų šalių poreikiams skirtos prietaisų skydeliai ir ataskaitos
Grįžtamojo ryšio kilpos
Sukurkite mechanizmus, kurie laikui bėgant padėtų tobulinti sistemą:
- Palyginkite prognozuojamus ir faktinius rezultatus, kad galėtumėte kalibruoti savo modelius.
- Stebėkite, kurios valdymo taisyklės sukelia klaidingus teigiamus rezultatus, ir koreguokite ribas.
- Atnaujinti pasitikėjimo balus pagal istorinį šaltinių tikslumą
Įgyvendinimo planas
Nesistenkite visko sukurti iš karto. Štai tokia seka, kuri veikia:
1 etapas (1-4 savaitės): Fondas
- Nustatykite pagrindinį neapibrėžtumo skleidimą vienam projektui
- Apibrėžti pasitikėjimo vertinimo metodiką
- Įgyvendinti tris pagrindines valdymo taisykles
2 etapas (5-8 savaitės): Plėtra
- Pridėti priklausomos rizikos koreliacijos modeliavimą
- Automatizuokite pasitikėjimo balų skaičiavimus
- Valdymo įspėjimų prijungimas prie "Power Automate
3 etapas (9-12 savaitės): Optimizavimas
- Įgyvendinti grįžtamojo ryšio ciklus ir modelio kalibravimą
- Pridėti prognozavimo analizę ankstyvam rizikos nustatymui
- Kelių projektų ir portfelių mastelio keitimas
Išvada
Rizikos valdymas - tai ne gražių prietaisų skydelių kūrimas ar atitikties kontrolinių sąrašų laikymasis. Reikia kurti sistemas, kurios suteikia tikslią ir tinkamą informaciją, kai reikia priimti sprendimus.
Mūsų aprašyta kiekybinės rizikos sistema - neapibrėžtumo sklaida, linijiniai patikimumo balai ir valdymas kaip kodas - pašalina pagrindinius tradicinių metodų trūkumus:
- Subjektyvius rizikos vertinimus pakeičia matematiniai modeliai.
- Jame atsižvelgiama į tai, kaip rizika didėja ir sąveikauja tarpusavyje.
- Sprendimų svoris priklauso nuo duomenų kokybės.
- Automatizuotas aptikimas ir reagavimas
Pastebėjome, kad šis metodas įvairiose pramonės šakose sumažina projektų nesėkmių skaičių 40-60%. Skirtumas ne įrankiuose, o sisteminiame mąstyme apie neapibrėžtumą ir valdymą.
Jūsų projektai yra pernelyg svarbūs, kad juos būtų galima valdyti spėjimais ir kasmėnesiniais susitikimais. Sukurkite sistemas, kurios veiktų automatiškai, anksti atskleistų problemas ir suteiktų jums pasitikėjimo, kad galėtumėte atlikti didesnius statymus.
Matematika nebėra pasirenkama. Arba jūs tinkamai kiekybiškai įvertinate riziką, arba rizika kiekybiškai įvertins jus.