Dashboard
Project Management Dashboard Qlik Sense follow a simple rule: show the right project information in the right aggregation to the responsible persons at one glance enabling them to make the right decisions.
In the project environment, there are different stakeholders, who have different information requirements and each with a different level of detail. The following examples show the most common two opposites.
Portfolio Level: There are portfolio-managers, who need to make sure, that the right projects are prioritized with the right ressources. Bottle necks need to be identified and project-pipelines need to be managed.
Project Level: Project managers need to get the lowest level of information in order to have all steering variables at hand. On the other side sponsors, review board members and CEOs need to receive the relevant essence of the information in order to derive the right decisions in the overarching project steering.
The LeapLytics Advanced Project Management Reporting makes sure, that all reporting requirements are possible, no matter what kind of stakeholder or aggregation level. Through the integative information process, all the information is collected on the lowest level and is aggregated to the need of all possible recipients.
Here are two examples of a project status reporting, that can be realized with our LeapLytics Extension Suite for QlikSense. The Dashboards use an underlying data model, that follows standard PMI-rules for project management. With that, enterprise wide projects can be reported in a harmonized, efficient and user friendly way.
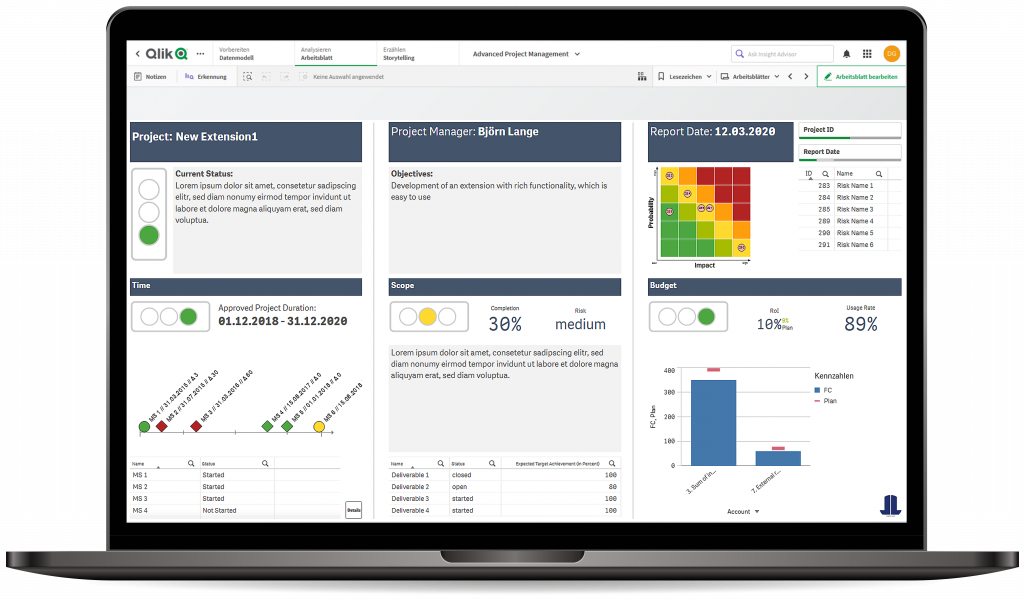
Project Status Report Qlik Sense
The basic project status report is one example of Project Management Dashboard Qlik Sense and lets the user select a dedicated project as well as reporting date. He gets all necessary information presented in a three column layout with relevant master data in the header. The main features are the Traffic Light and the Risk Matrix.
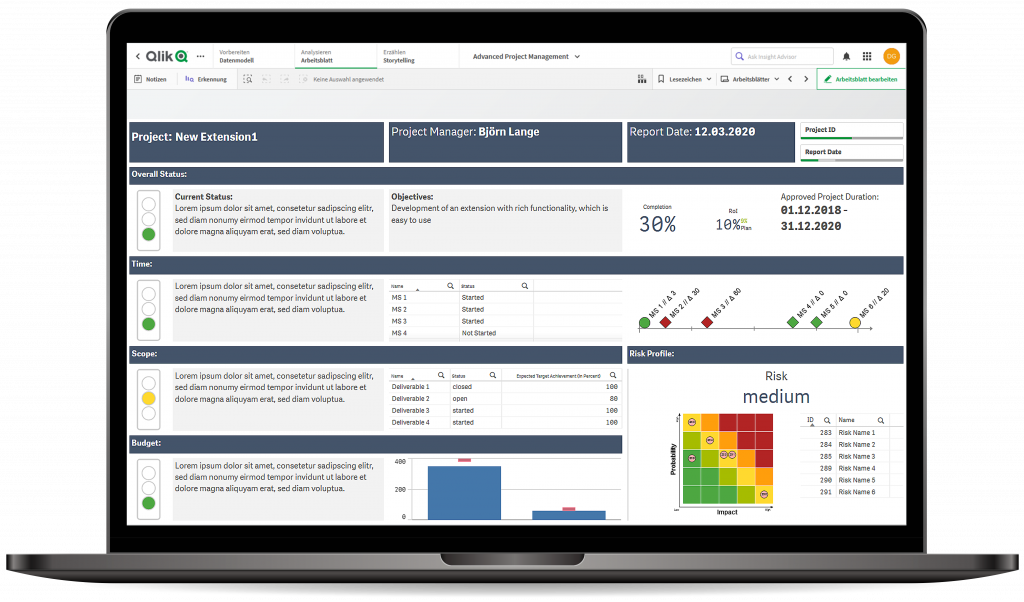
A variant of the basic project status report tips the layout to a horizontal view and adds the Milestone View as a main feature to get an overview on relevant Milestones and their target achievement.
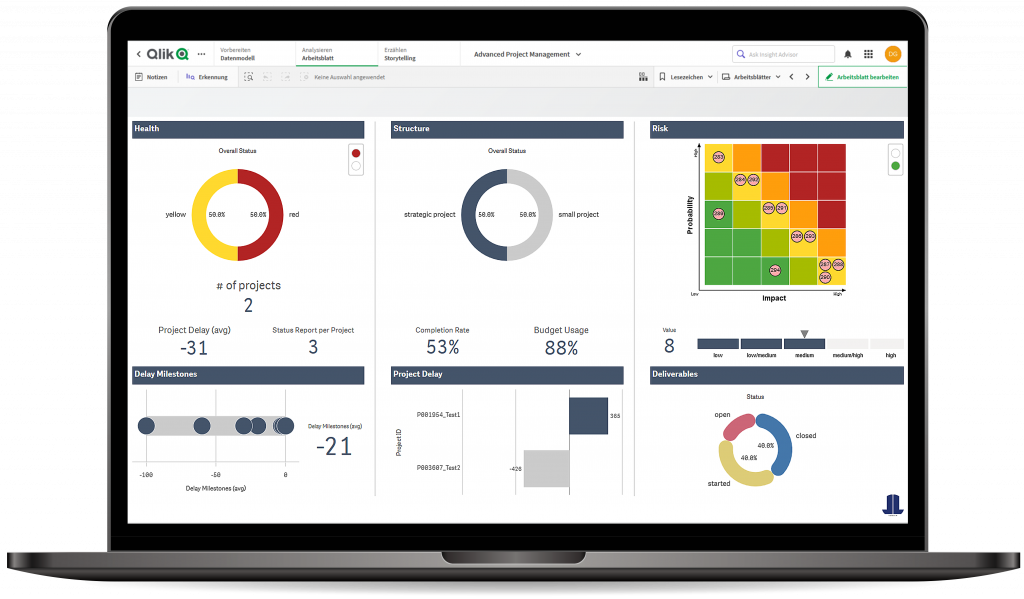
Our extension can also be used in overarching Portfolio-Dashboards.
If you are curious what this would mean for your project management environment, we are happy to arrange a call with you. In this case or if you have questions regarding details, implementation and pricing information please let us know and we are contacting you on short notice: