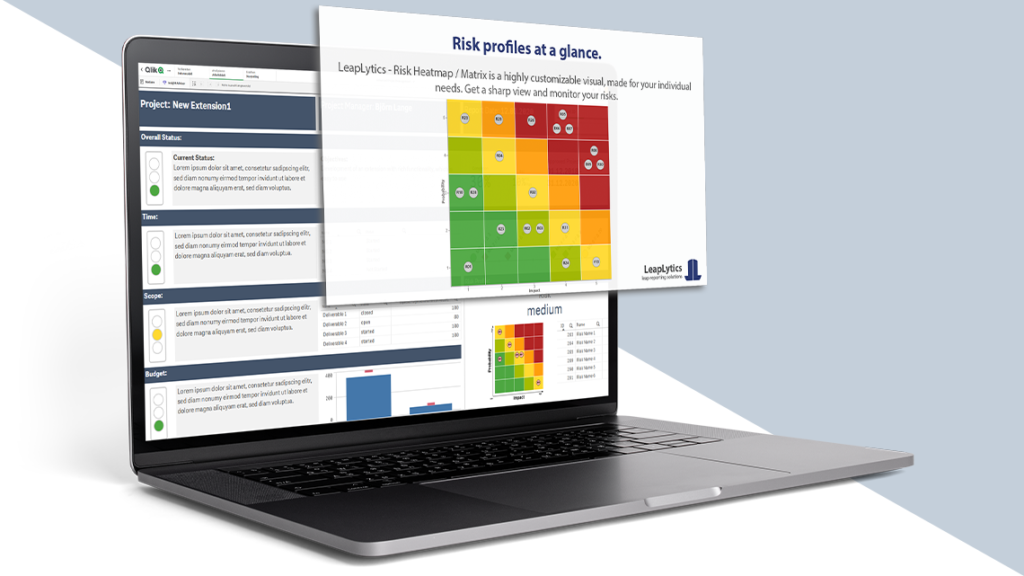
Get a sharp visual view on your risk profiles with the Risk Matrix / Heatmap for Qlik Sense! This extension is built to visualize profiles, that are measured in a matrix of two KPIs and different categories. It is able to visualize multiple indicators per field. You can freely and dynamically select all expressions between a 3×3 and 5×5 matrix. Various settings like custom colors, flexible border and text settings adapts this extension to your reporting needs.
Get It Now!
FREE Version
The FREE Version of LeapLytics – Risk Matrix is free to use for four weeks on any server and in any company. Test now whether our solution meets your requirements.
Watermark removed
Individual Grid Size
User Defined Color Scheme
Color Inverter
Border Settings
Axis Settings
Indicator Settings
Text Settings
Color Settings
Navigations & Actions
Printable*
PRO Version
The PRO Version of LeapLytics – Risk Matrix unleashes the full power of this visual. One license per server and company – One price per year.
Watermark removed
Individual Grid Size
User Defined Color Scheme
Color Inverter
Border Settings
Axis Settings
Indicator Settings
Text Settings
Color Settings
Navigations & Actions
Printable*
* see QlikSense limitations
Documentation
Subscribe here to receive exclusive updates and releases: Subscription
Introduction Risk Matrix Extension for Qlik Sense
Get a sharp visual view on your risk profiles with the Risk Matrix for Qlik Sense! The extension is built to visualize profiles, that are measured in a matrix of two KPIs and different categories. It is able to visualize multiple indicators per field. You can freely and dynamically select all expressions between a 3×3 and 5×5 matrix. Various settings like custom colors, flexible border and text settings adapts this extension to your reporting needs.
This extension can also be used for monitoring and indicating thresholds for all types of physical measures, quality indicators and divergences in general. With this, it can be applied to a broad number of uses cases, that occur different businesses. The following listing shows a selection of possible uses cases, that had been already implemented:
Project Management: Visualize risk and opportunity profiles for a project, program or portfolio
IT: Indicate applications, that are in green, yellow or red area of status (performance, health)
Getting Started with our Risk Matrix for Qlik Sense
Open Qlik Sense and the relevant app, where you want to use the “Risk Matrix” extension. Open your worksheet in edit mode and you will find the extension within the “Custom Objects” section. Drag and Drop the extension to any area on your dashboard (You can change the appearance of the extension later in the advanced settings).
After you have placed an instance of the extension to your dashboard, the following properties panel will appear on the right side. The properties panel is separated into the following sections:
- Measures
- Dimensions
- Ranges (general matrix layout)
- Grid Settings (everything inside the matrix)
- Axis Settings (everything around the matrix)
- Indicator Settings (everything regarding matrix-content)
- About
In the following , you will learn how to use LeapLytics “Risk Matrix” extension and how to customize it to your needs by using the properties correctly.
Measures
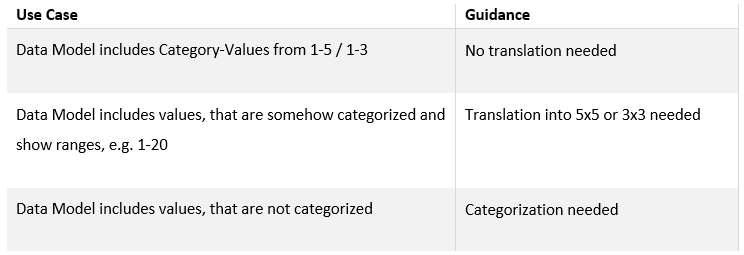
The measure defines the value for the relevant two KPIs of the matrix. The first KPI defines the X-Axis-KPIs and the second KPI defines the Y-Axis-KPI. They can be switched individually. The matrix is expecting values in the range between 1 and 5 (5-field-matrix) or 1 and 3 (3-field-matrix). Also decimals are possible, if useful. The values can be taken from the data model directly, if a pre-system is already capturing and calculating the range. If the data model includes any kind of units, the categories can be created within the formular individually.
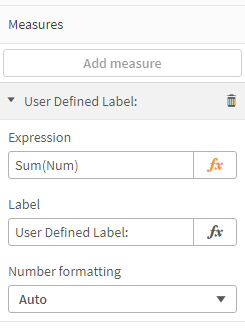
You can add a measure like this:
- Click the “Add measure” button in the properties panel under the section “Measure” or by clicking the “Add measure” button inside the extension window on your dashboard
- Choose a measure from the dropdown list and click on it
- (Optional): Choose the right aggregation for your needs (Sum, Avg, Min, Max, etc.) or define an individual formula.
When using individual formulas, the following examples can be taken as a guidance:
Dimensions
Use the dimension in order to give the indicators a striking name. This can be e.g. an ID or short-name (1-2 words). Longer names or descriptions are not recommended, as the space of the matrix itself is limited.
Advanced Settings
Within the Matrix Settings you can make several selections.
Matrix Settings: First, you can fix the aspect ratio. This keeps the visualization in a square state. In addition, you can set the size of the x- and y-direction individually by using the slider. If your data is outside these ranges, you will get a visual hint in the extension! Furthermore you can invert the colors with one click. Finally, you can define the width of the border or disable it completely.
Grid Settings: Use the Grid Settings to configure the matrix itself, e.g. size or configuration of the borders. You can also invert the color-coding, that a higher category has the color “green” and a lower category is turning into red. It is also possible to switch off the table with detailed values.
Axis Settings: The Axis settings let you configure the frame to your needs. You can decide to switch off texts, axis or high/low-indication.
Indicator Settings: Use the indicator settings in order to change the size and appearance of the indicators in the Grid.
Navigation & Action
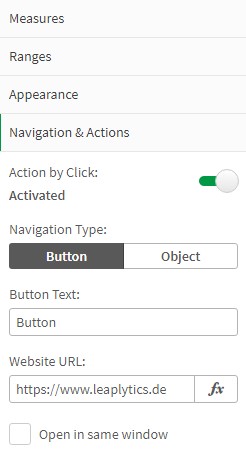
You can apply Navigation & Actions to your extension to navigate to Qlik Sense Sheets, websites, etc. You can activate “Actions” with the corresponding button. “Risk Matrix” supports two different navigation types:
- Button: Choose “Button” to add a button underneath your traffic light icon. You can rename the button by using the “Button Text” field. Enter a URL for a website or Qlik Sense Sheet you want to navigate to*. You can open the URL in the same window or in a separate tab by using the “Open in same window” checkbox.
- Object: As an alternative you can choose “Object” to make the entire object clickable (“Button Text” field will be hidden). Enter a URL for a website or Qlik Sense Sheet you want to navigate to*. You can open the URL in the same window or in a separate tab by using the “Open in same window” checkbox.
*URLs always have to start with “http://www.” or “https://www.”
About our Risk Matrix for Qlik Sense
This Qlik Sense extension is developed by LeapLytics. The About-Section show information regarding this extension.
Version: Shows the installed version of this extension
License valid until: Shows the license expiring date
License valid on server: Shows on which server ID this extension can be used
Version History
| Version | Date | Content |
| 1.4 | 14.02.2022 | New API Usage |
| 1.3 | 13.12.2021 | Risk Matrix Upgrade |
| 1.2 | 26.04.2021 | Navigation & Actions added, More than 9 risks support scrollable indicator table |
| 1.1 | 28.01.2021 | Subscription functionality for release upgrades & improved properties panel |
| 1.0 | 13.11.2020 | Initial Version |