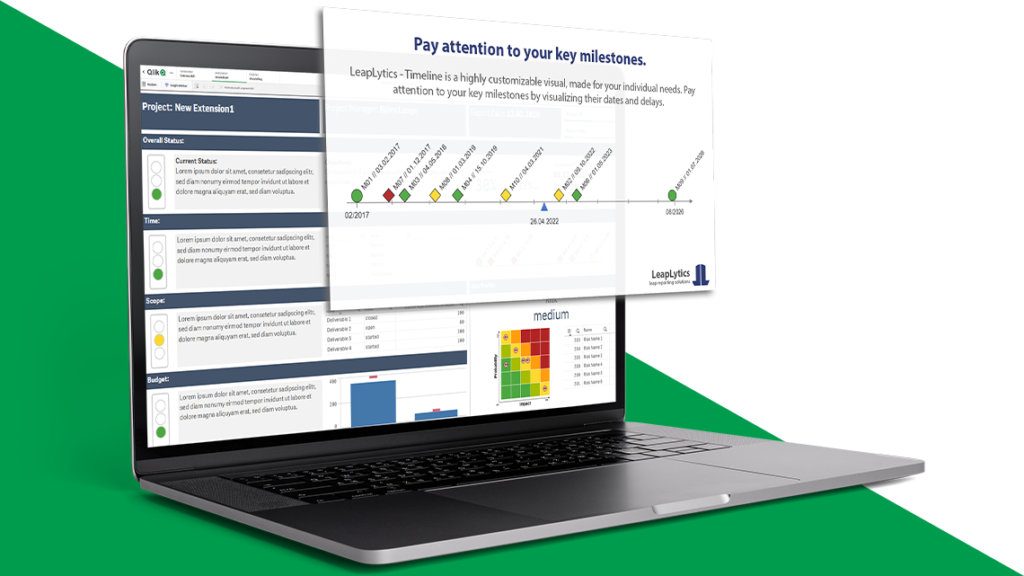
In all projects, Milestones and Timelines serve as relevant management metrics, providing the means to define project priorities, monitor progress and tell an overarching story, in which status your project is. With this extension, you are able to show the distribution of your milestones over the project runtime as well as a visual trigger of the status.
Documentation
Subscribe here to receive exclusive updates and releases: Subscription
Introduction Timeline Extension for QlikSense
Besides defining project priorities and monitoring progress, the Timeline extension allows us to display relevant information like name, date and a date deviation, e.g. plan to forecast or actual to forecast, to our needs. With the plan-to-forecast deviation comes a color coding, that gives a direct visual trigger. Individual settings allow you to adapt the extension on the dashboard to your needs.
As a major advantage the extension is automatically recognizing, which duration the project has and adjusting the axis divider accordingly in three steps (week, month, year).
The following listing shows a selection of possible use cases, that had been already implemented:
Project Management: Visualize important milestones and their status in proper distance to each other according to the time differences.
Process Management: Show sequential steps of a process and their status (late or in time) in order to manage process inefficiencies directly by visual triggers.
Axis Divider
The extension is rendering axis divider accordingly to the project duration. Three cases are available:
| Use Case | Guidance |
| Weekly | If the project duration (first – last milestone*) is < 1 month, the axis is divided by weeks |
| monthly | If the project duration (first – last milestone*) is < 18 month, the axis is divided into month |
| yearly | If the project duration (first – last milestone*) is > 18 month the axis is divided in years |
*The first and last milestone can also be the project start and project end, if this is included in the data model.
Getting Started
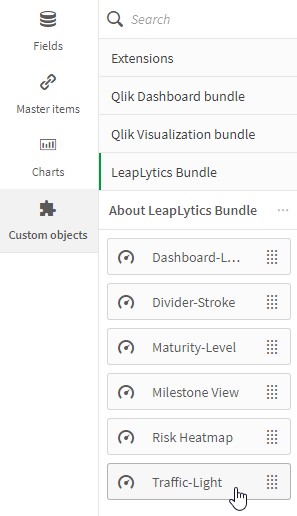
Open Qlik Sense and the relevant app, where you want to use the “Milestone View” extension. Open your worksheet in edit mode and you will find the “Milestone View” extension as well as all your other purchased LeapLytics extensions under “LeapLytics Bundle” within the “Custom Objects” section. Drag and Drop the extension to any area on your dashboard (You can change the appearance of the extension later in the advanced settings).
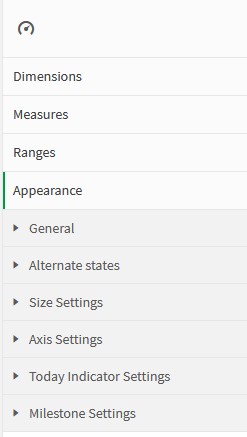
After you have placed an instance of the extension to your dashboard, the following properties panel will appear on the right side. The properties panel is separated into the following sections:
- Dimensions
- Measures
- Ranges
- Appearance
- Size Settings
- Axis Settings
- Today Indicator Settings
- Milestone Settings
- Navigation & Actions
- About
In the following chapters, you will learn how to use LeapLytics “Milestone View” extension and how to customize it to your needs by using the properties correctly.
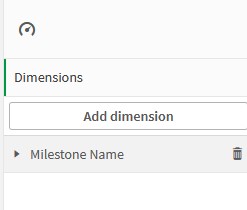
Dimensions
The dimension is the leading indicator of the extension. This is the Name- or ID-field of the milestone. Only the first dimension will be shown in the extension.
Measures
The measures represent the date field itself in order to place the milestone on the axis. Please make sure, that a proper date field and proper date forma is available. The first entry is always responsible to place the milestone on the axis, the second entry is responsible for calculating the deviation and with that the visual trigger (red, yellow, green). Within the PMI-Project Management Practice, the project baseline is the major date measure to be shown in the first place. A forecast of the milestones is usually taken as the reference measure (Second measure) in order to show major delays.
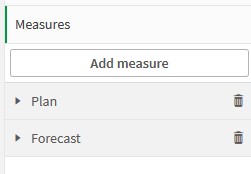
You can add a measure as follows:
- Click the “Add measure” button in the properties panel under the section “Measure” or by clicking the “Add measure” button inside the extension window on your dashboard
- Choose a measure from the dropdown list and click on it
- It is not recommended to choose any kind of aggregation, as this function will lead to wrong values in combination with dates.
If you want to use the aggregation formular, consider the following rules:
| Use Case | Guidance |
| The date format in your dataset corresponds to the date format set in your load script. E. g. in the main section of your load script | Then you can keep the aggregation function (i. e. Avg()) set by default by Qlik for a measure. |
| The date format in your dataset differs to the date format set in your load script | Then you have to remove the aggregation function around your date field. E. g. different or unknown date format in your dataset. |
Ranges
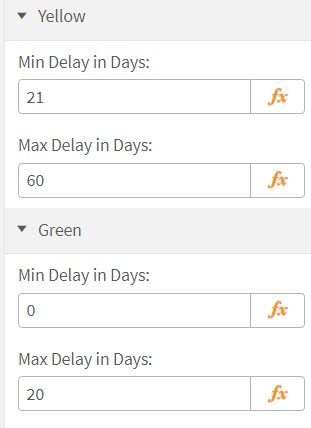
The ranges define the colours of different ranges of deviations from first to second measure. Please bear in mind, that the first measure from the measures-section is subtracted from the second one. This means, that the general perspective of the range needs to be aligned to the expectation, e.g. a positive deviation can be seen also positive or negative.
Example:
If the second date is before the first date, the deviation has a negative sign:

In this case, a higher negative number means also a higher negative timely deviation, which is rather negative. The ranges need to be configured from min to max with decreasing values:
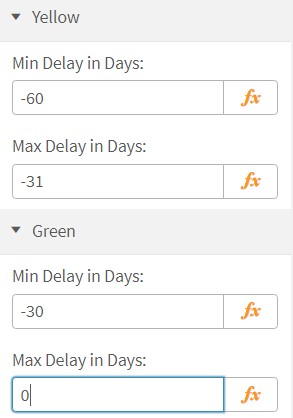
The common deviation is calculated by subtracting a forecast from a plan value:

In this case, the ranges need to be configured with increasing values in order to show, that a higher deviation is rather negative.
Here, the green section can also be configured with open ranges. That means, that Min (green) and Max (red) it can be left empty.
Advanced Settings
The Settings can be generally differentiated in 5 level:
- Size Settings
- Axis Settings
- Today Indicator Settings
- Milestone Settings
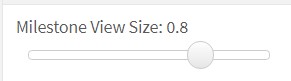
Size Settings: Use the slider to adjust the size of the whole extension.
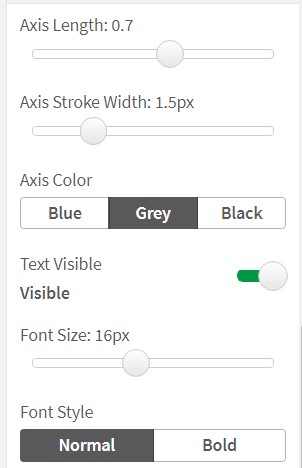
Axis Settings: The Axis settings let you configure the size of the axis to your needs, e.g. colours and width. You can decide to switch off texts, text size and style.
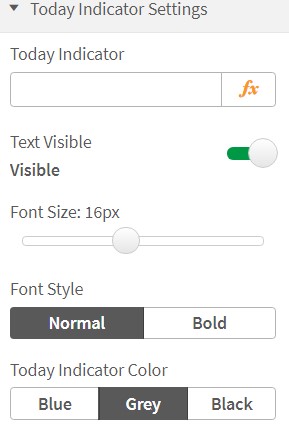
Today Indicator: The today indicator settings let you format an indicator, that show the current date or any kind of date function. You can use this indicator in order to show a certain reporting or due date, e.g. reporting due date per quarter.
You are able to style the indicator to your needs:
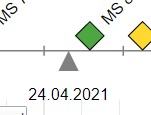
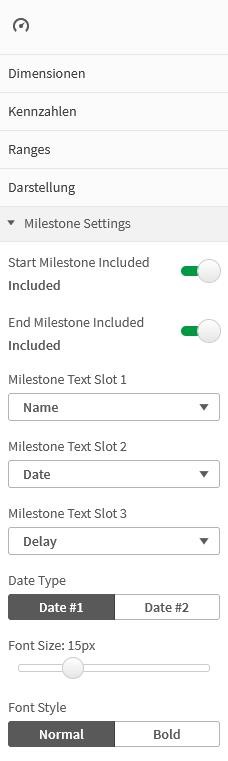
Milestone Settings: The milestones have various settings to adapt the stye to your needs. One major feature is to select if your data set includes a start- and end milestone. This is then shown as a circle instead of a diamond. You can also select, if a certain information is displayed and even in which order.
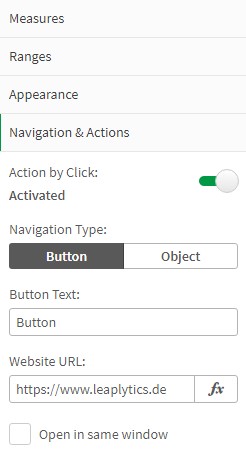
Navigation & Actions
You can apply Navigation & Actions to your extension to navigate to QlikSense Sheets, websites, etc. Actions need to be activated with the corresponding button. “Milestone View” supports two different navigation types:
- Button: Choose “Button” to add a button underneath your traffic light icon. You can rename the button by using the “Button Text” field. Enter a URL for a website or QlikSense Sheet you want to navigate to*. You can open the URL in the same window or in a separate tab by using the “Open in same window” checkbox.
- Object: Choose “Object” to make the entire object clickable (“Button Text” field will be hidden). Enter a URL for a website or QlikSense Sheet you want to navigate to*. You can open the URL in the same window or in a separate tab by using the “Open in same window” checkbox.
*URLs always have to start with “http://www.” or “https://www.”
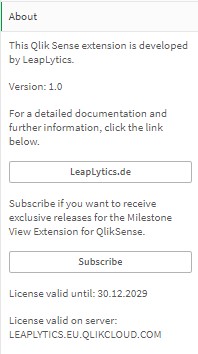
About
This Qlik Sense extension is developed by LeapLytics. The About-Section show information regarding this extension.
Version: Shows the installed version of this extension
License valid until: Shows the license expiring date
License valid on server: Shows on which server ID this extension can be used
Compability
This extension has been tested with:
Version History
| Version | Date | Content |
| 1.0 | 26.04.2021 | Initial Version |