Our visuals for Power BI are certified by Microsoft and can be customized to incorporate your individual solutions. With a clear structure and user-focused design, our visuals enhance your dashboard and make it easy to implement your ideas without sacrificing important functionality!


Traffic Light Power BI Visual
![]()
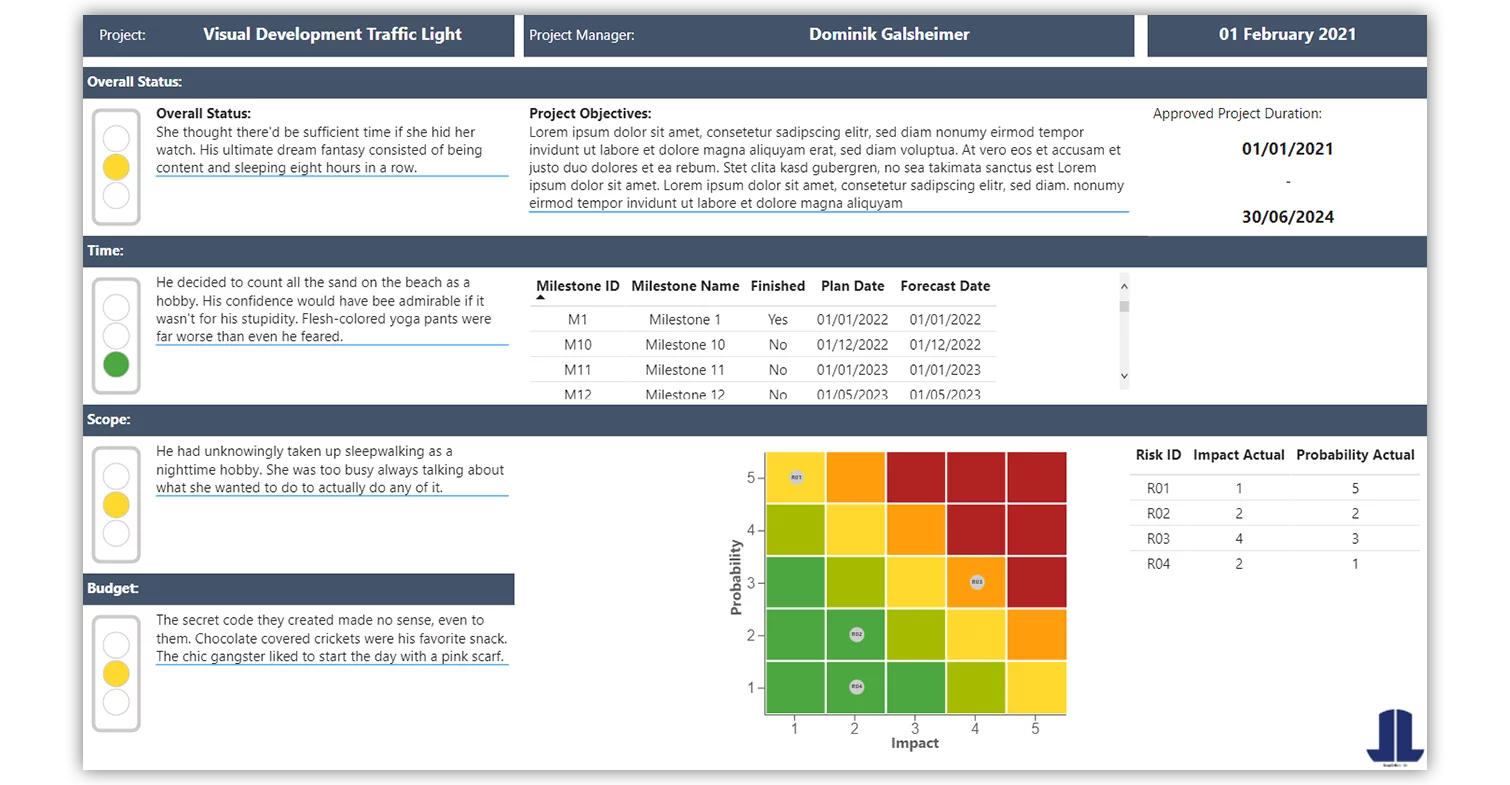
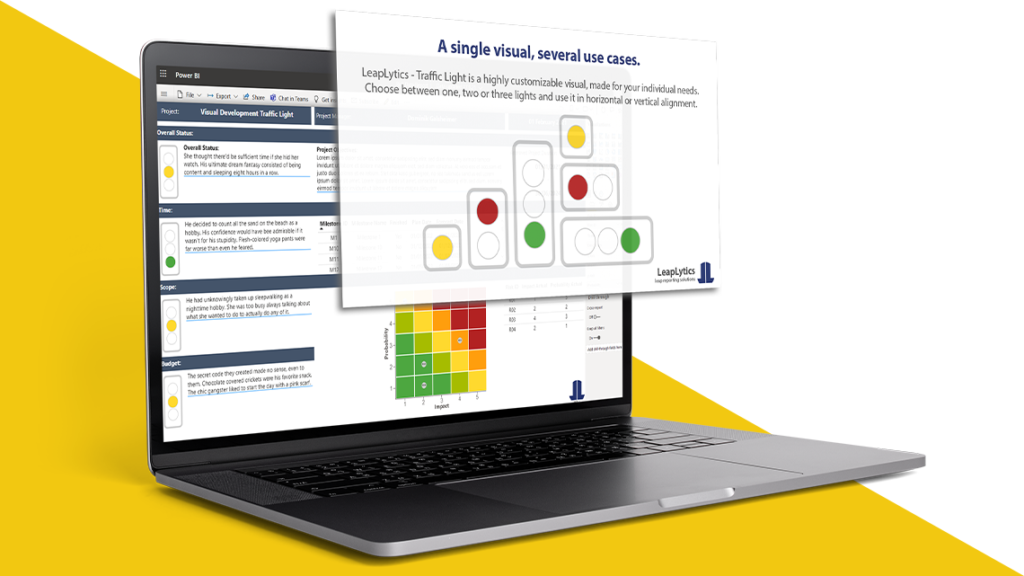
This traffic light solution allows you to easily keep track of your project status and any thresholds, making it a valuable Power BI Visual for monitoring your key performance indicators. With its high level of customization, “Traffic Light” is the ideal tool for staying on top of your KPIs.
“Traffic Light” is a versatile Power BI Visual that can be used for monitoring and indicating thresholds for all types of physical measures, quality indicators, and divergences. With a broad range of applications, this visual is an effective tool for businesses in any industry.


Risk Matrix Power BI Visual
![]()
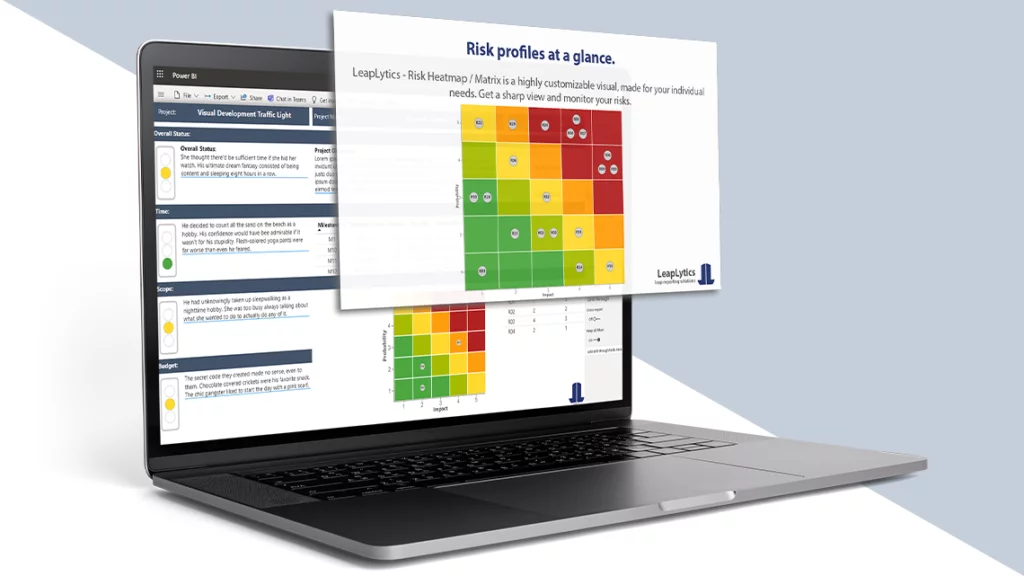
The Risk Matrix for Power BI offers a clear, visual view of your risk profiles, making it easy to monitor and understand your risks better. With the ability to visualize multiple indicators per field, this visual is a valuable tool for gaining insight into your risk profiles.
The Risk Matrix is a powerful tool for taking control of your risk assessment. With its clear, visual representation of your risk profiles, this visual enables a sharp understanding of your risks.
