![]()
“Traffic Light” is a customizable Microsoft Power BI visual that offers visual alerts for all your key performance indicators. With features like horizontal and vertical alignment and a one/two/three light system, this visual can be tailored to your reporting needs, giving you better control over your KPIs!
Benefits
Decision-Maker
As a decision-maker, you need clear, meaningful reporting that allows you to see at a glance where your time and attention are needed. Our Traffic Light Visual for Microsoft Power BI makes this possible, providing immediate alerts when key figures are outside tolerable ranges.
Quickly identify areas that may require your attention or improvement, allowing you to make more informed and timely decisions. This will help you to optimize the performance of your organization and ultimately achieve better results.
Department Manager / Consultant
As a manager or consultant, you don’t need any programming knowledge to use the Traffic Light Visual for Microsoft Power BI. All complex implementations are already done for you, so you can start using it right away. Simply define the critical value ranges and customize the design to fit your business needs.
Our extension seamlessly integrates into your dashboards, saving you time and improving the meaningfulness of your reports. Impress your clients or supervisors with the Traffic Light visual for Power BI.
Engineer / Developer
If you’re building BI dashboards, let us help you complete your project successfully. Our Traffic Light visual for Power BI offers flexible logic and fully customizable design, allowing you to impress your clients with impressive, professional dashboards. Save time and energy with our visual, and take advantage of our personal, direct support for any questions or concerns you may have.
Clear communication and easy handling improve your service and make your job easier.
Features

Light System
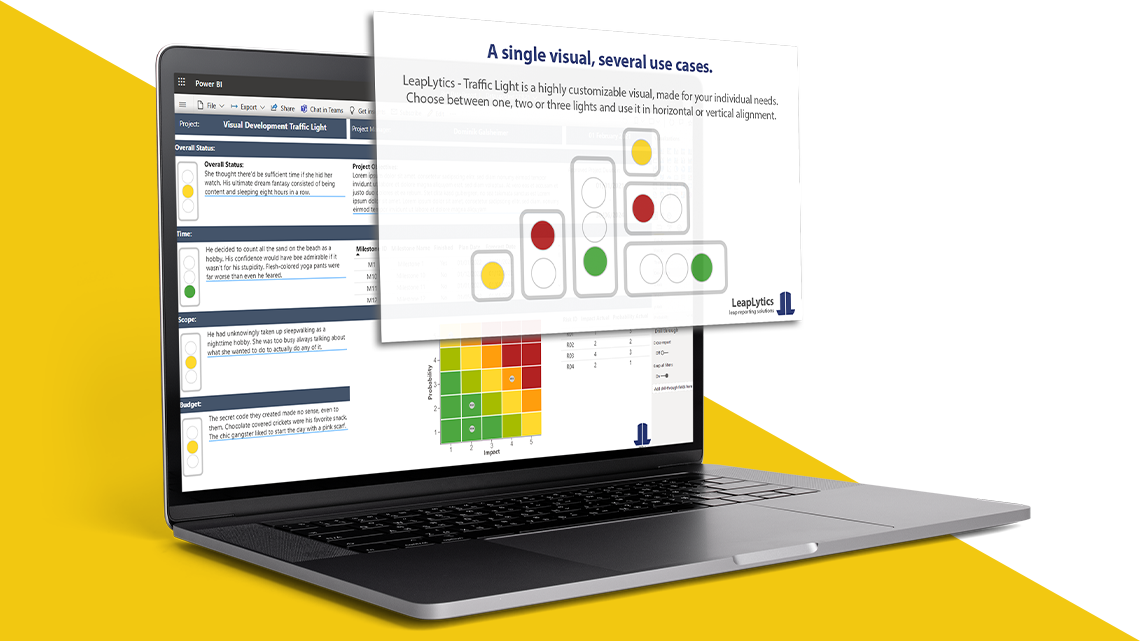
Choose between a one-, two- and three-light system.

Alignment
Use the Visual in vertical or horizontal alignment.

Color Settings
Change the color of all graphical items to meet your CI-standards.
Text Settings
Make use of the text settings, to fit the text appearance to your individual needs.

PBI Certified
This visual meets the highest Microsoft security standards and supports export to PDF and PowerPoint.
Get It Now!
TRIAL Version
The TRIAL Version of LeapLytics – Traffic Light is free to use for four weeks on any server and in any company. Test now whether our solution meets your requirements.
Three Light System
Two Light System
One Light System
Vertical Alignment
Horizontal Alignment
Border Settings
Text Settings
Color Settings
PRO Version
The PRO Version of LeapLytics – Traffic Light unleashes the full power of this visual. One license per server and company – One price per year.
Three Light System
Two Light System
One Light System
Vertical Alignment
Horizontal Alignment
Border Settings
Text Settings
Color Settings