Have you just found out about the Traffic Light visual in Power BI and are wondering what the next steps are?
Then you’ve come to the right place! In our step-by-step guide, supported by our video tutorials, we will guide you through the setup and customization of our visual.
1. Download the visual
2. Prepare your data
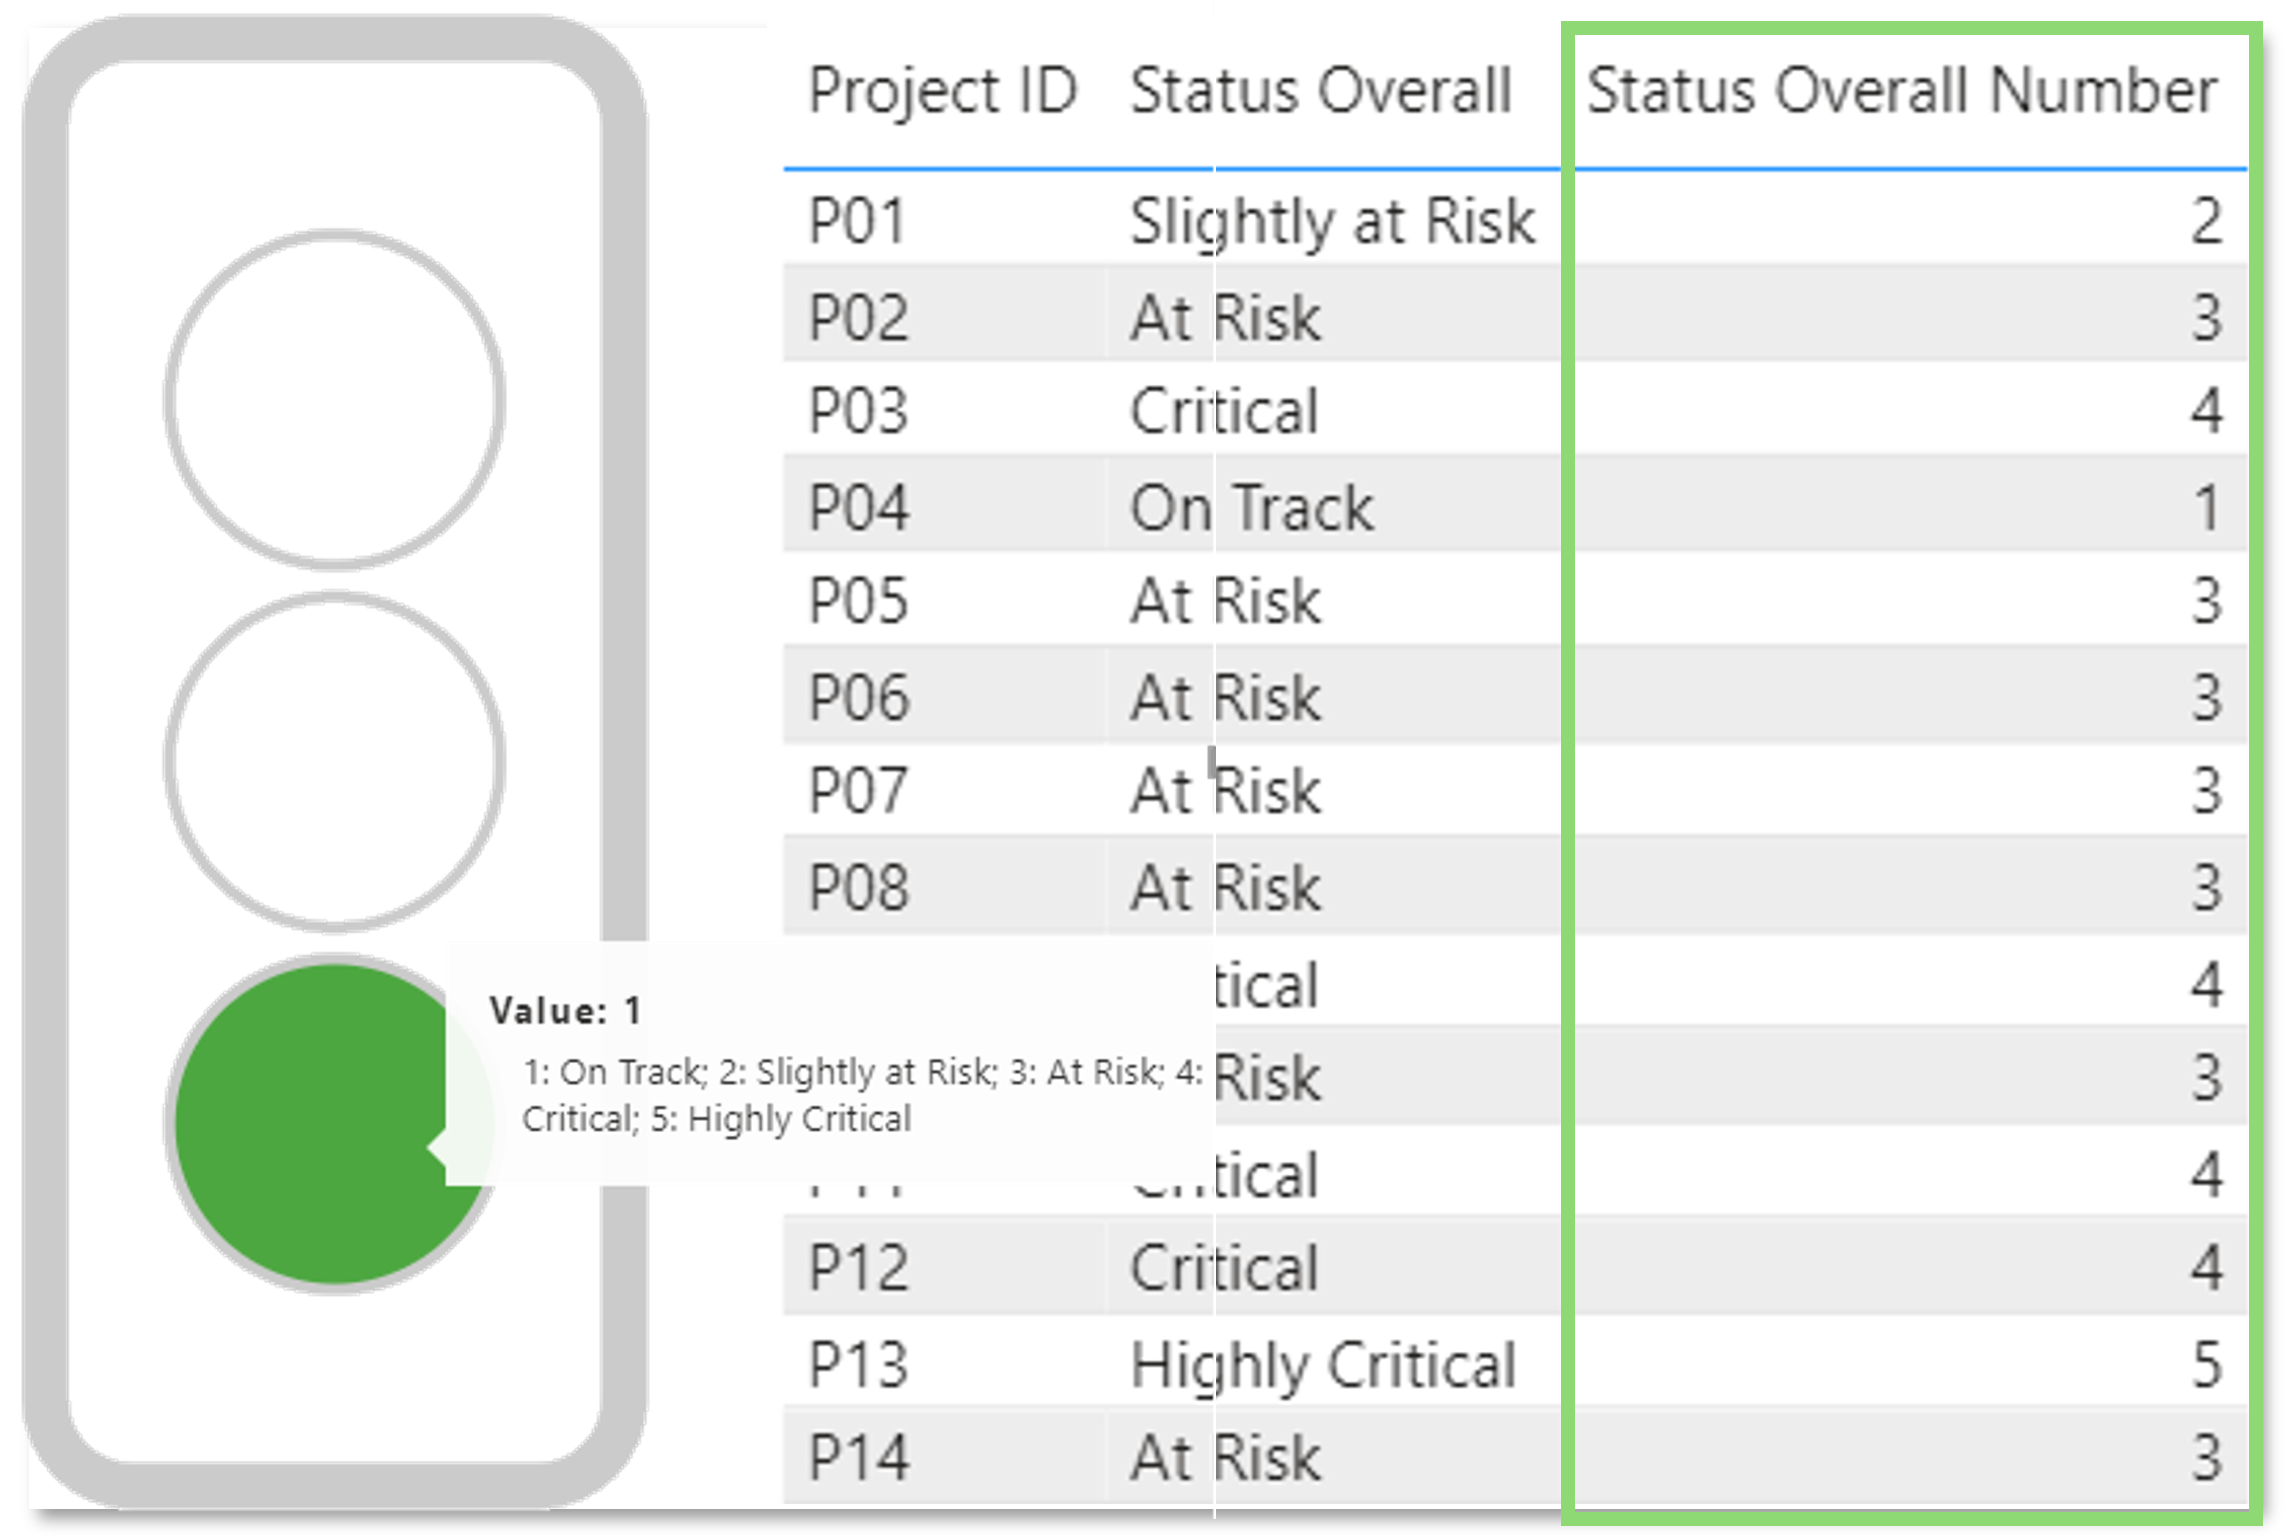
Our Traffic Light requires either numeric, percentage or time values (e.g. date) to set up ranges for each light color.
Make sure to adjust your data of interest to one of the supported data formats.
3. Data and license import
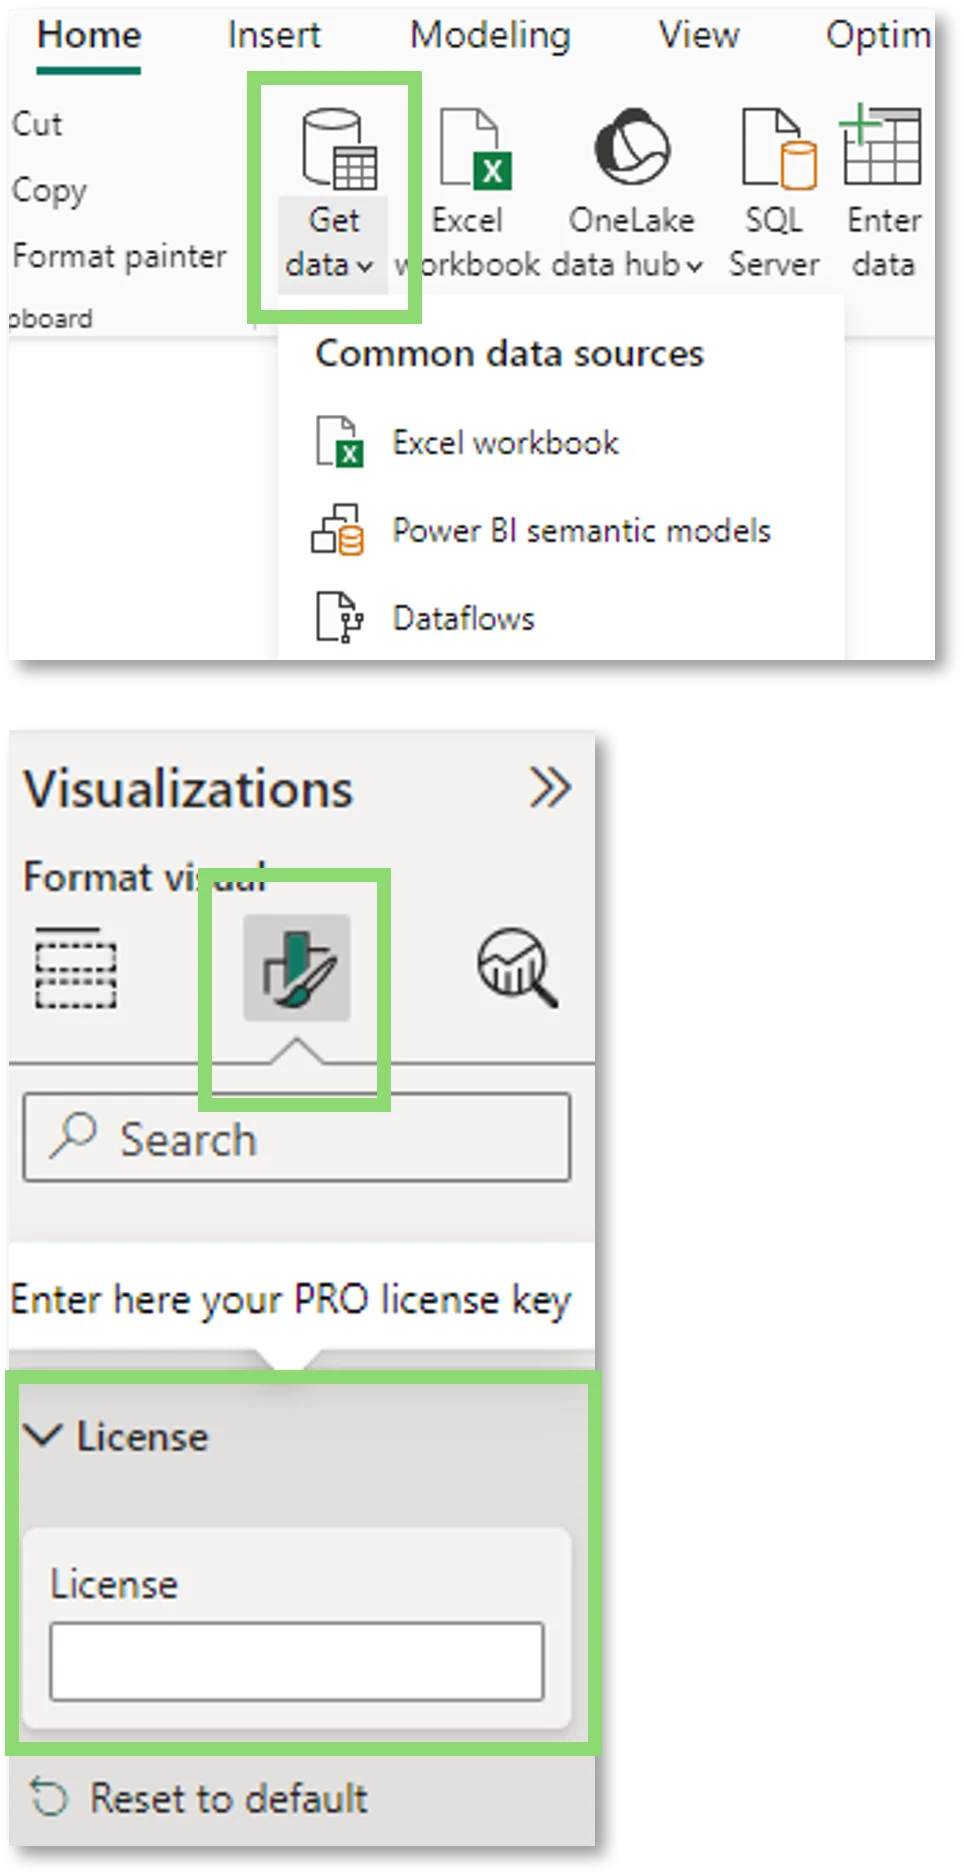
To import your data, click on “Get data” from the data pane and select your respective data source, for instance, an excel workbook.
In a next step, select the visual from the visual list to add it to your Power BI report. Now, click on “Format your visual” under visualizations and choose the “license” section.
Here you can simply insert your license code via CTRL + V.
4. Visual set up
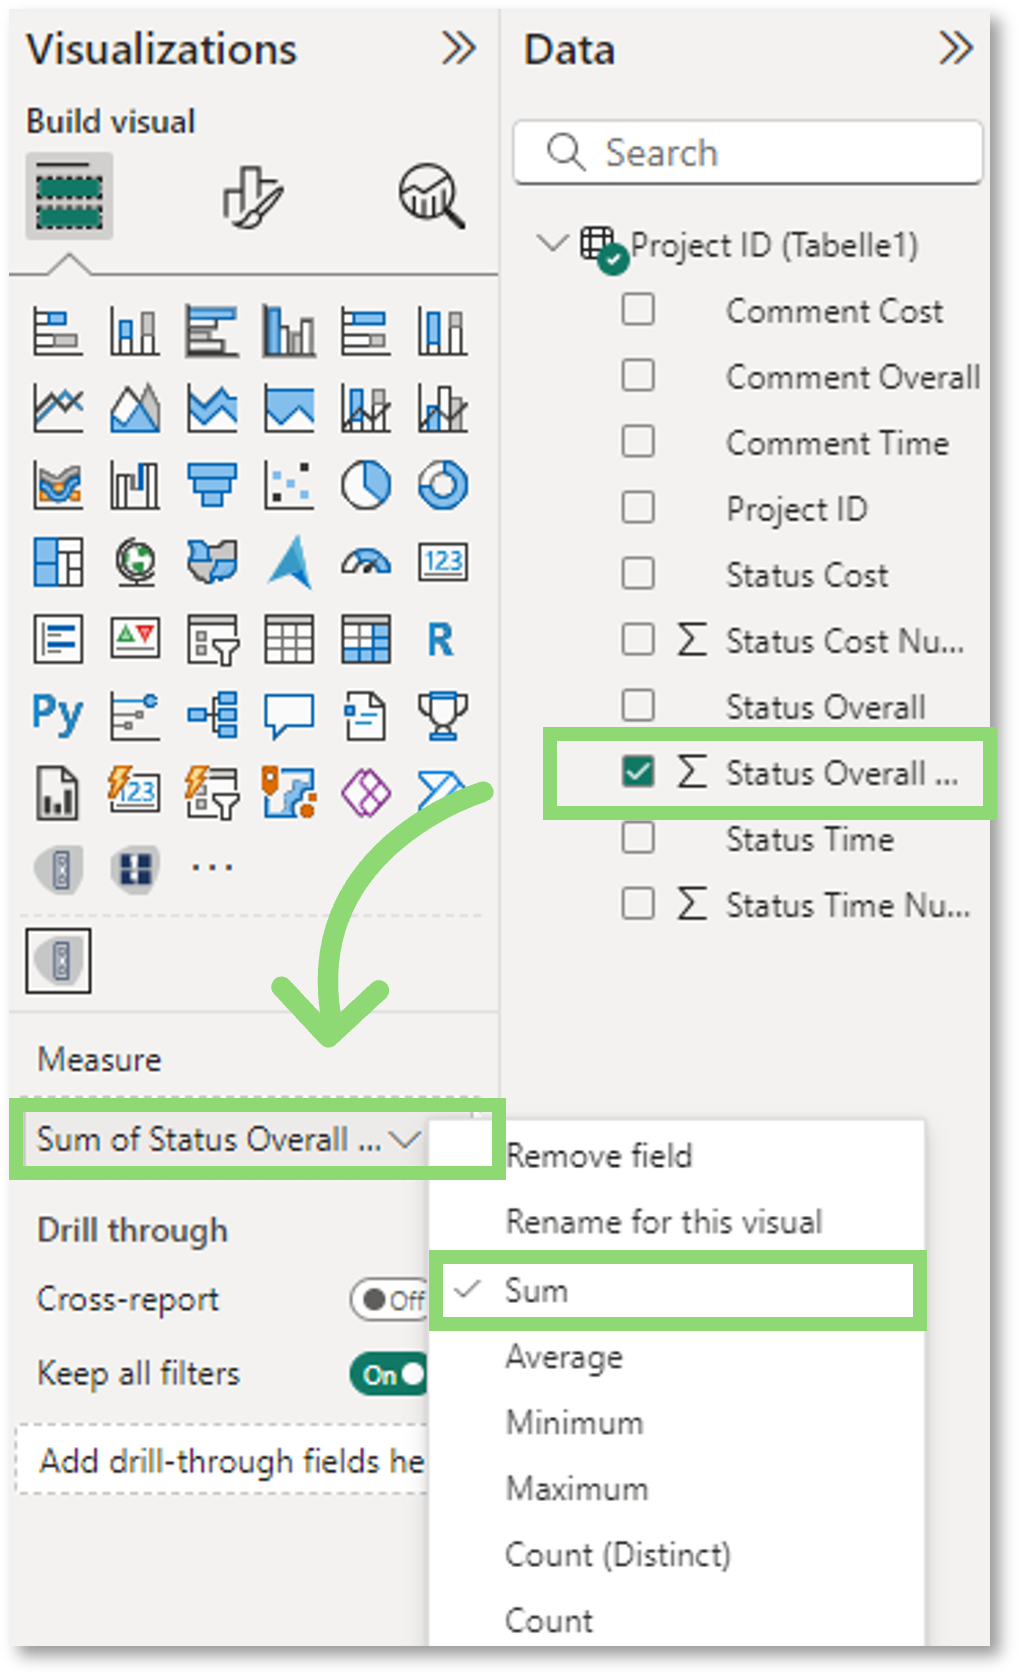
Select your measure of interest from the “Data” section by clicking on it or dragging it onto the “Measure”-field of the visual.
Optional: By clicking on the dropdown, you can choose the right aggregation for your needs (Sum, Average, etc.).
When using time formats, it must be ensured, that the format is set according to the format of the selected measure.
5. Setting ranges
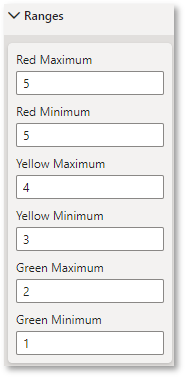
Next, to make your “Traffic Light” visual work properly, you need to define the ranges for displaying the light colors. In the “Ranges” section under “Formt your visual”, you can define minimum and maximum values for the corresponding color*.
When a date or interval measure is selected in the measure-section, you need to define the ranges accordingly to the selected time format within the time format section.
*Yellow Minimum and Yellow Maximum is deactivated, if “Two-Light System” is selected.
6. Customize your favorite design
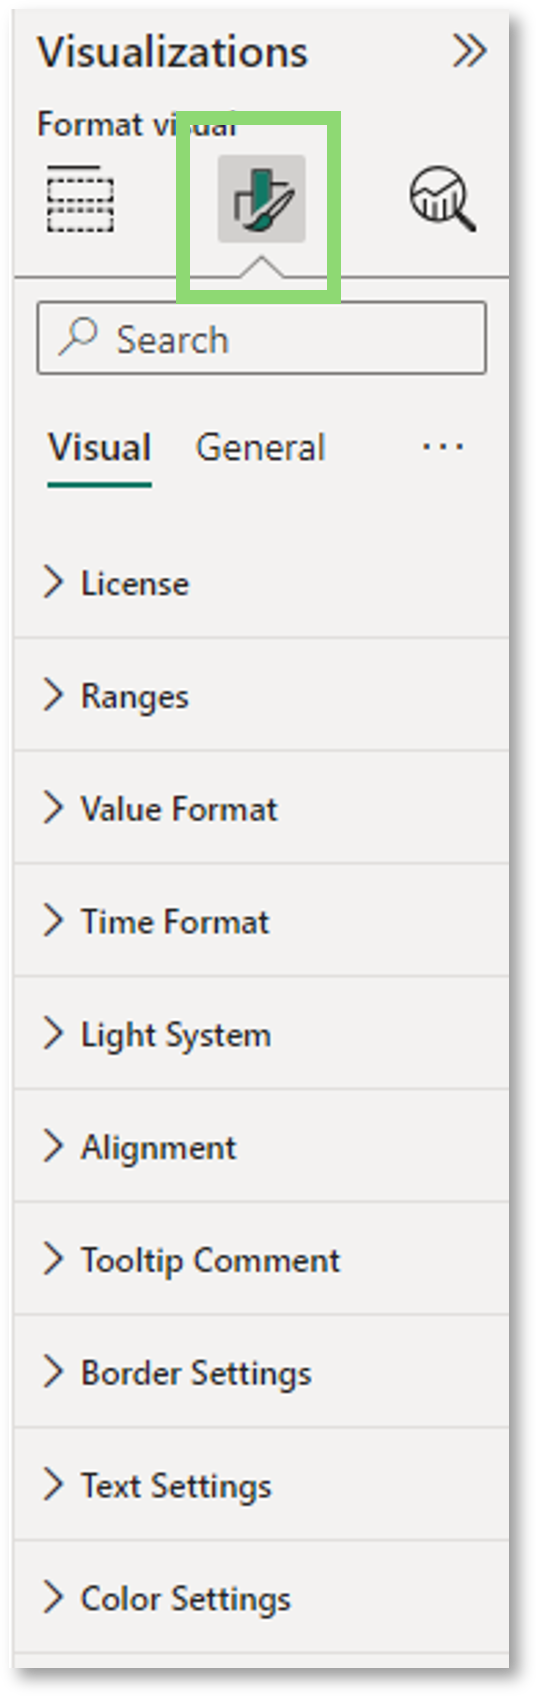
In a last step, we can customize the visual to an individual design. When clicking on “Format your visual” under visualizations, you will see the following panel.
Here you can adapt all the formatting options by choosing your favorite design.
Instructions on each formatting option, can be found in our video tutorial above.
Perfect, you are now ready to use our Traffic Light and enhance your reporting!