Minimum Requirements | License | Features | Zoom & Pan | Filter | Troubleshooting
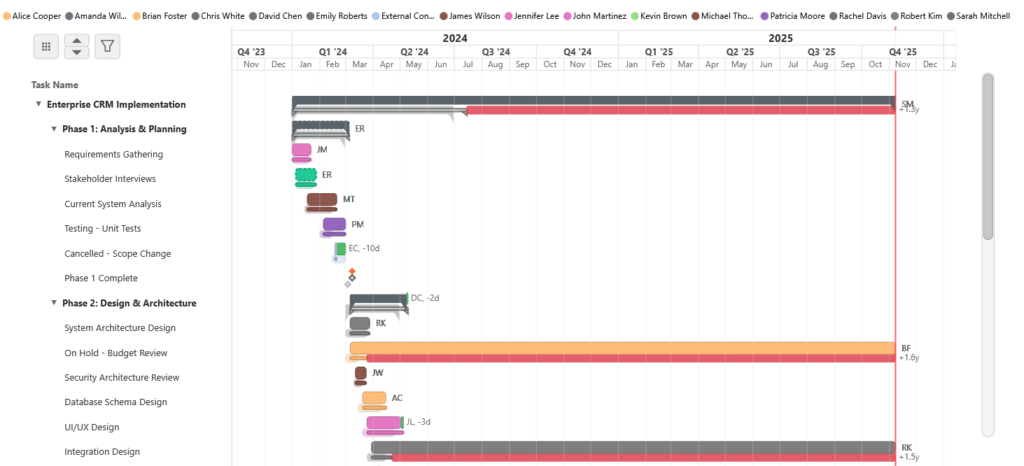
Teams across industries use the LeapLytics Gantt Chart to visualize project timelines, dependencies, milestones, hierarchies, and resource allocations directly inside Power BI. The visual is fast, and built for enterprise-grade reporting. With features such as dynamic zooming, critical path display, customizable timeline styling, dependency arrows, milestone types, baselines, and full hierarchy support, users gain an immediate, reliable overview of every project.
If your project data is available, you can fully configure and operationalize the LeapLytics Gantt Chart in under 5 minutes. You will have a functioning Gantt including tasks, dates, dependencies, milestones, and formatting—ready for presentation, analysis, and stakeholder reporting.
Minimum Requirements
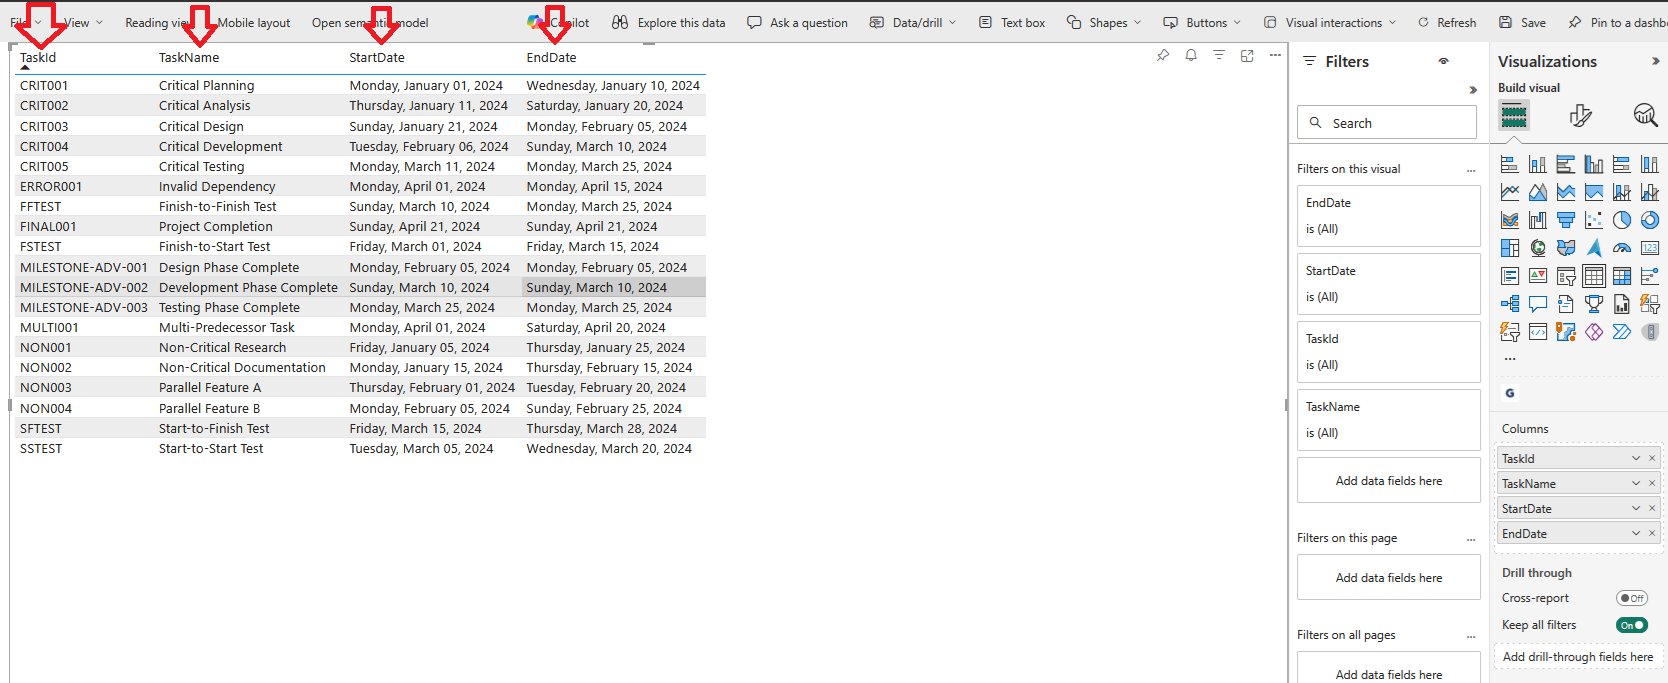
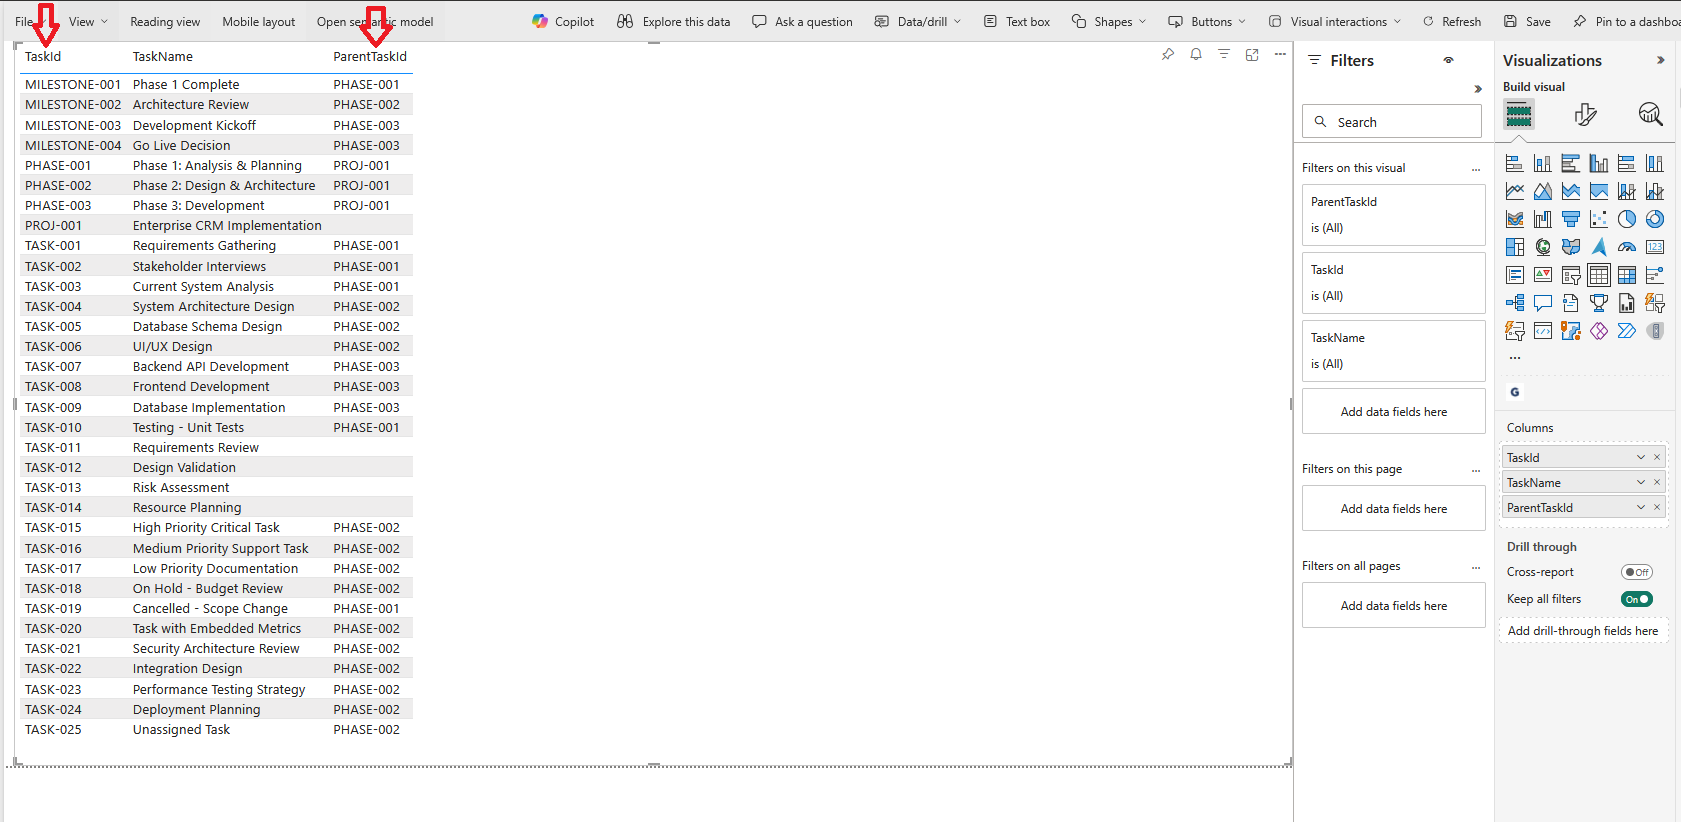
⚠️ Important: Your data should follow a tabular structure with each row representing a task and columns containing task properties.
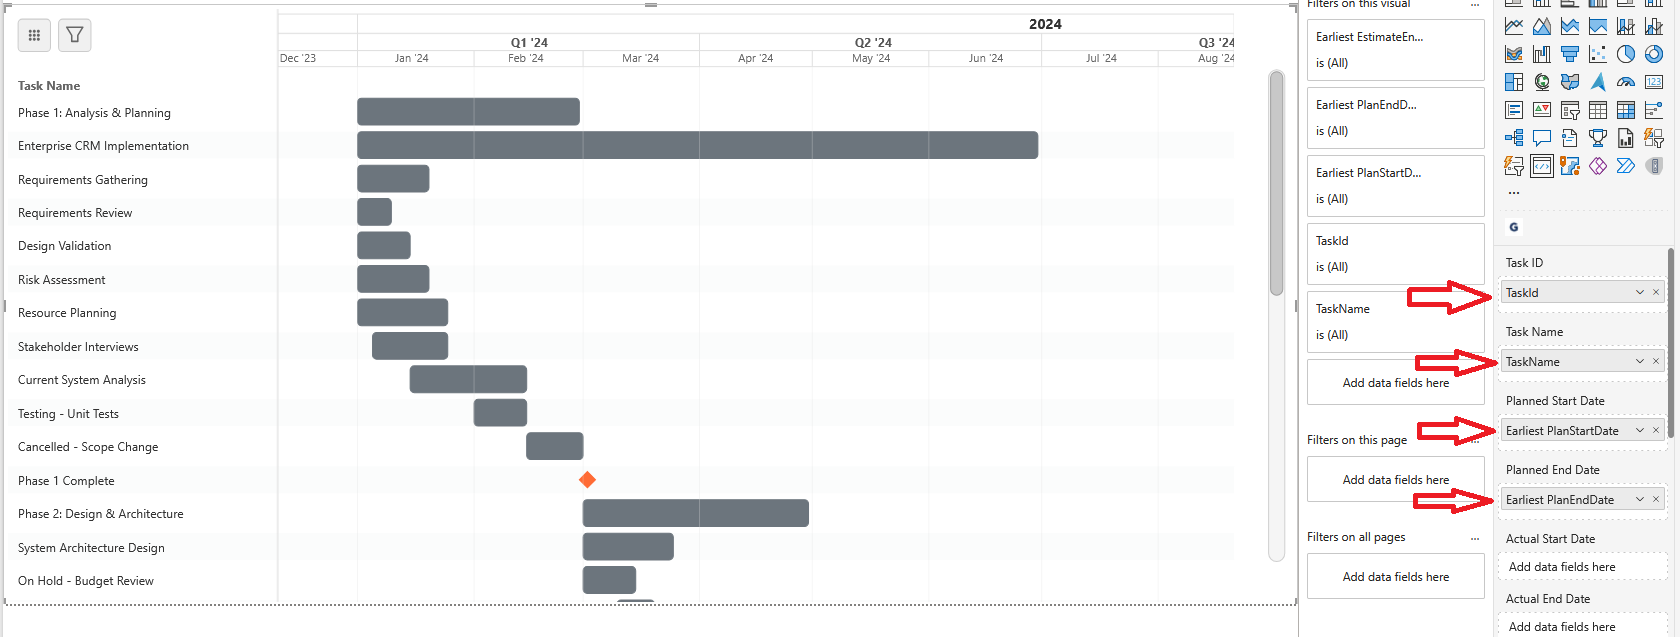
The visual requires only a minimal set of fields to produce a fully functional timeline. Each task must include a unique Task ID, a readable Task Name, and a pair of dates that define its duration. These dates may be Planned, Actual, or Estimated—the visual automatically detects the type of data you provide and adjusts the timeline accordingly. With this flexibility, the Gantt can represent simple plan-only schedules, full plan-versus-actual comparisons, or advanced scenarios that combine planned, actual, and estimated timelines in parallel.
Because the visual interprets the date types on its own, you can supply whichever fields your project data already contains. If you include all three (Planned, Actual, Estimated), the Gantt displays all corresponding bars. If you provide only a single set of dates, it renders a single timeline bar. Duration fields may also be used instead of end dates; when both duration and end date are present, the duration value takes precedence. All date fields must be in a Power BI–compatible datetime format to ensure correct rendering.
  -- =====================================================
  -- REQUIRED FIELDS (Minimum data needed)
  -- =====================================================
  'TASK-001'                AS Task ID,              -- Unique identifier
  'Requirements Analysis'   AS Task Name,            -- Display name
  '2025-01-01'             AS Planned/Estimated/Actual Start Date,    -- Start date
  '2025-01-15'             AS Planned/Estimated/Actual End Date,      -- End date

  -- ===== DATA SCENARIOS SUPPORTED =====
  -- The visual automatically detects which data you provide:
  --
  -- 1. Plan-Only (Baseline):        Planned Start Date + Planned End Date only
  -- 2. Actual-Only (As-Built):      Actual Start Date + Actual End Date only
  -- 3. Plan vs Actual:              Both Planned AND Actual dates (shows both bars)
  -- 4. Plan + Estimated:            Planned + Estimated dates (shows plan bar + thin estimate)
  -- 5. Actual + Estimated:          Actual + Estimated dates (shows actual bar + thin estimate)
  -- 6. Plan + Actual + Estimated:   All three date types (shows all three timeline bars)
  -- 7. Estimated-Only:              Estimated Start Date + Estimated End Date only
  --
  -- ===== NOTES =====
  -- • Duration fields are optional and override corresponding EndDate fields when both provided
  -- • Date fields must be in datetime format recognized by PowerBI
License
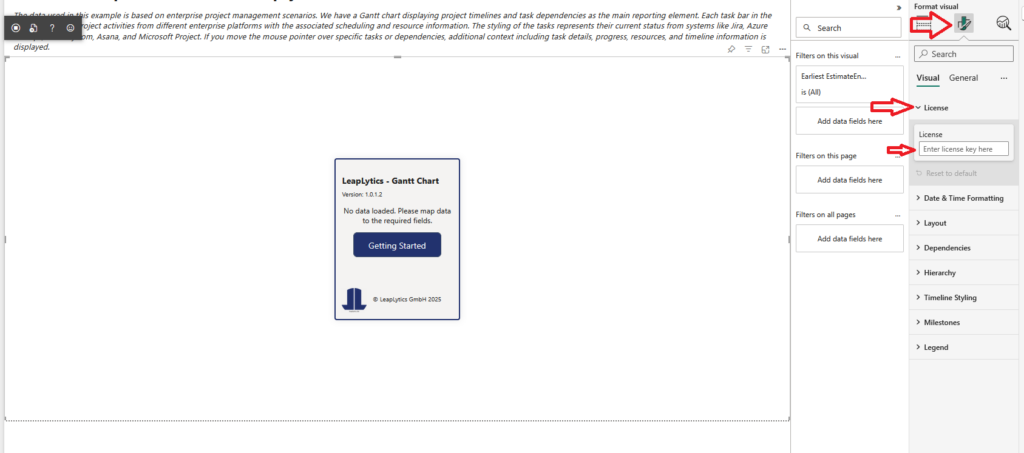
Copy your license code and paste it into the License field by pressing CTRL+V. If you do not yet have a trial license, you can request one here.
Features
The LeapLytics Gantt Chart provides enterprise-grade project visualization with features such as task hierarchies, progress tracking, resource assignments, dependencies, milestones, and flexible timeline navigation ranging from minute-level detail to decade-long views. It automatically interprets Planned, Actual, and Estimated dates, displays matching timeline bars, and offers complete styling and baseline options—ensuring professional, high-clarity reporting directly inside Power BI.
If your data is available, you can set up a fully functional Gantt—including tasks, dates, dependencies, milestones, formatting, and navigation—in under 5 minutes. The visual adapts instantly to the fields you provide, enabling fast configuration with minimal effort and delivering a ready-to-use timeline for teams, managers, and stakeholders.
Hierarchy
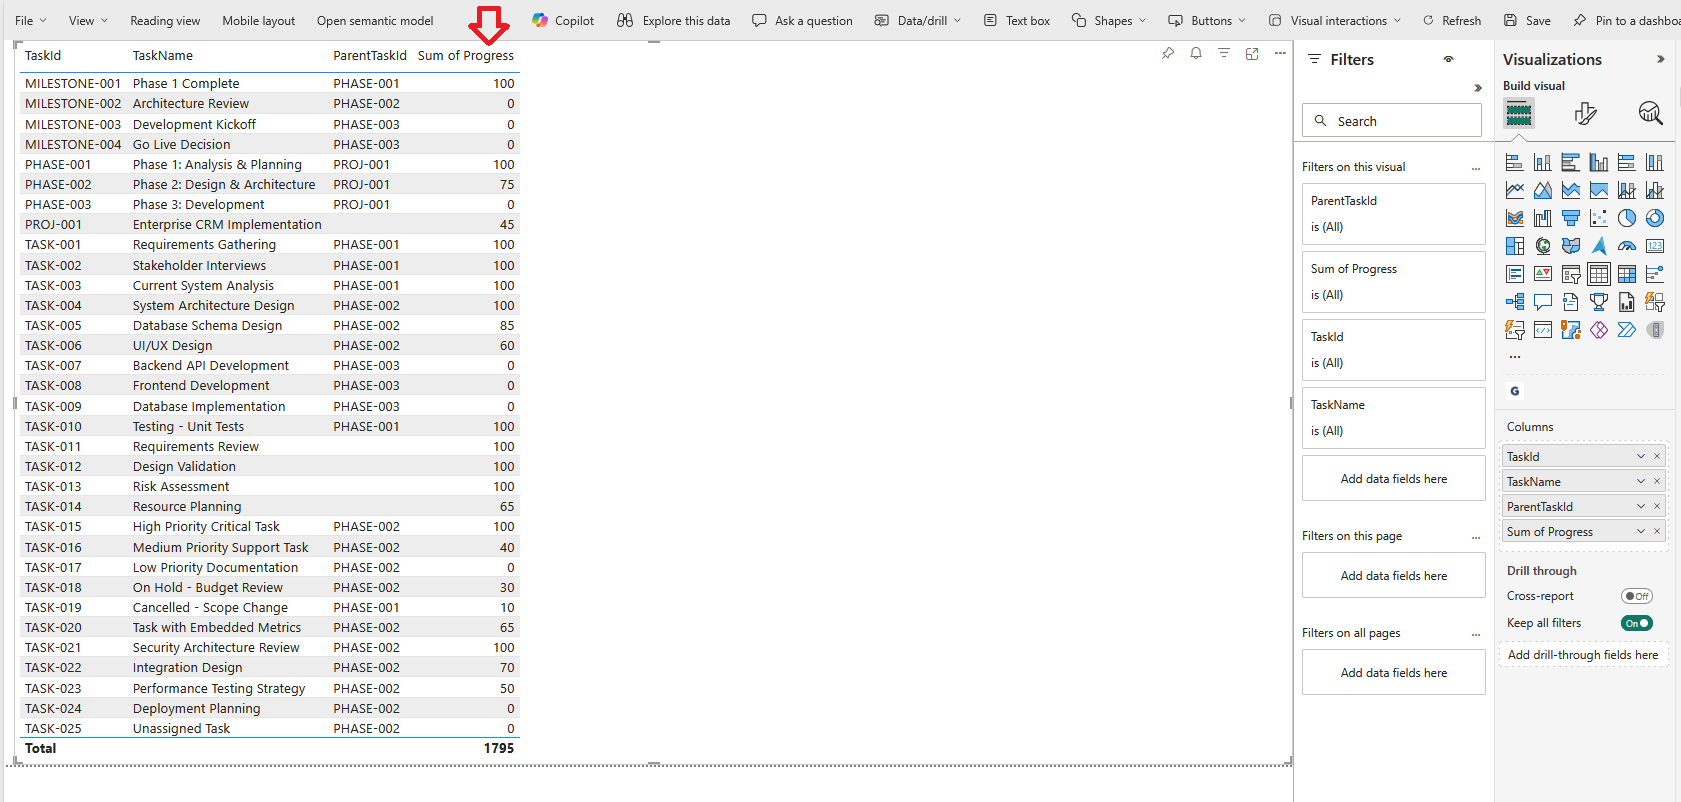
The Hierarchy feature allows you to structure your project into parent and child tasks, creating a clear and intuitive breakdown of work. By assigning each task a Parent Task ID, the Gantt Chart automatically builds nested levels that reflect your project’s true structure. This enables roll-up visibility, collapsible groups, and a clean overview of complex projects, helping teams understand phases, work packages, and detailed sub-tasks at a glance.
    'PROJ-001'               AS ParentTaskID,        -- Parent task for hierarchy
  -- ===== NOTES =====
  -- • Hierarchy: Task ID for parent task
Progress
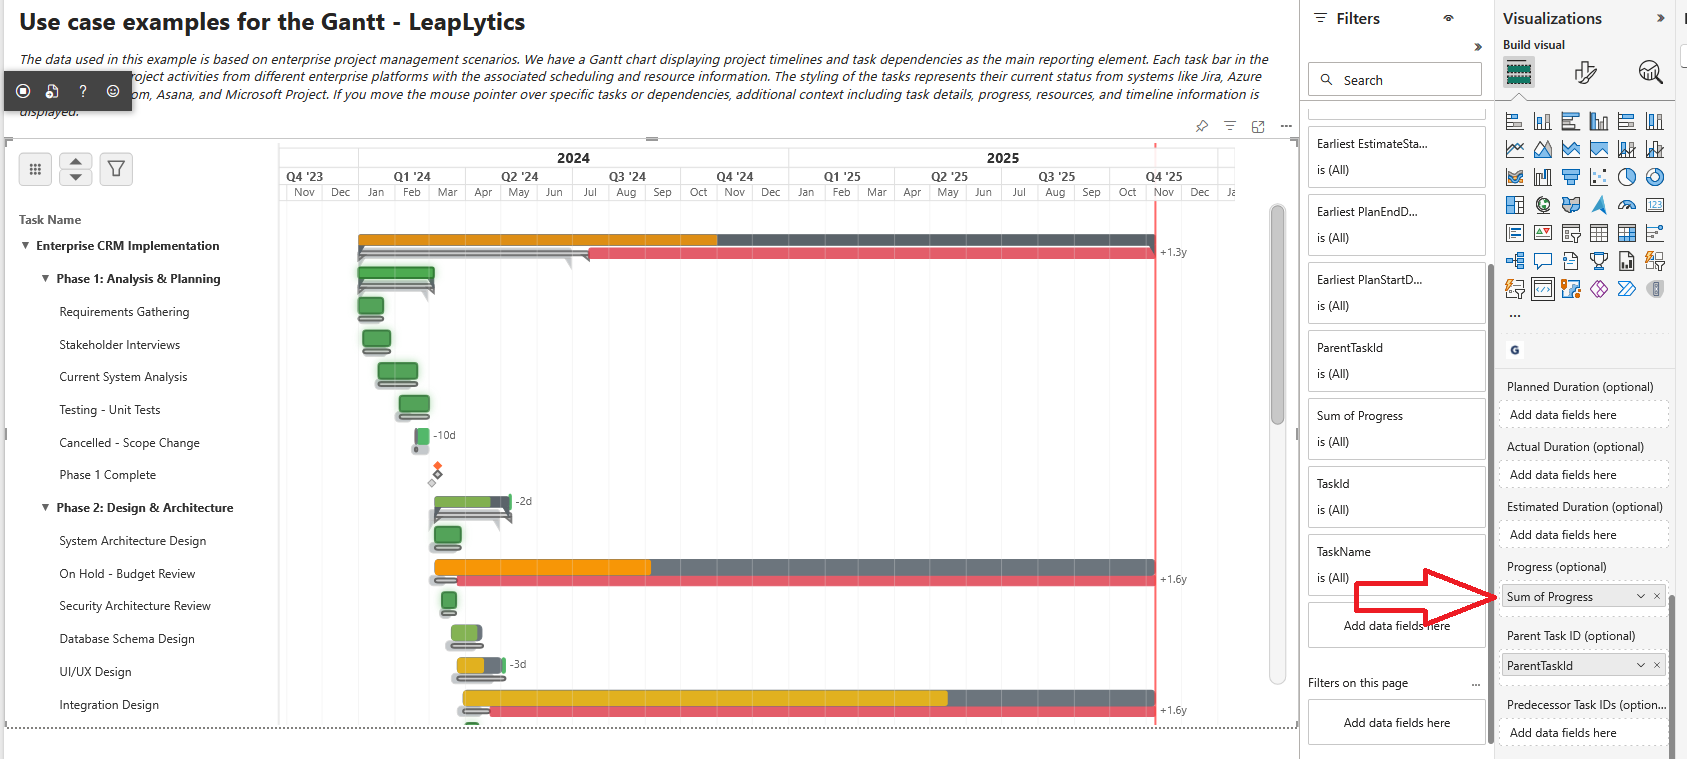
The Progress field allows you to track task completion directly within the Gantt Chart. By providing a percentage value between 0 and 100, the visual clearly displays how far each task has advanced, enabling immediate insight into project status. Whether a task is not started, partially complete, or fully finished, progress indicators help teams and stakeholders monitor execution and identify areas that may require attention.
  -- =====================================================
  -- PROGRESS
  -- =====================================================
  65                       AS Progress,             -- Completion % (0-100)
  -- ===== NOTES =====
  -- • Progress: 0 = not started, 100 = complete
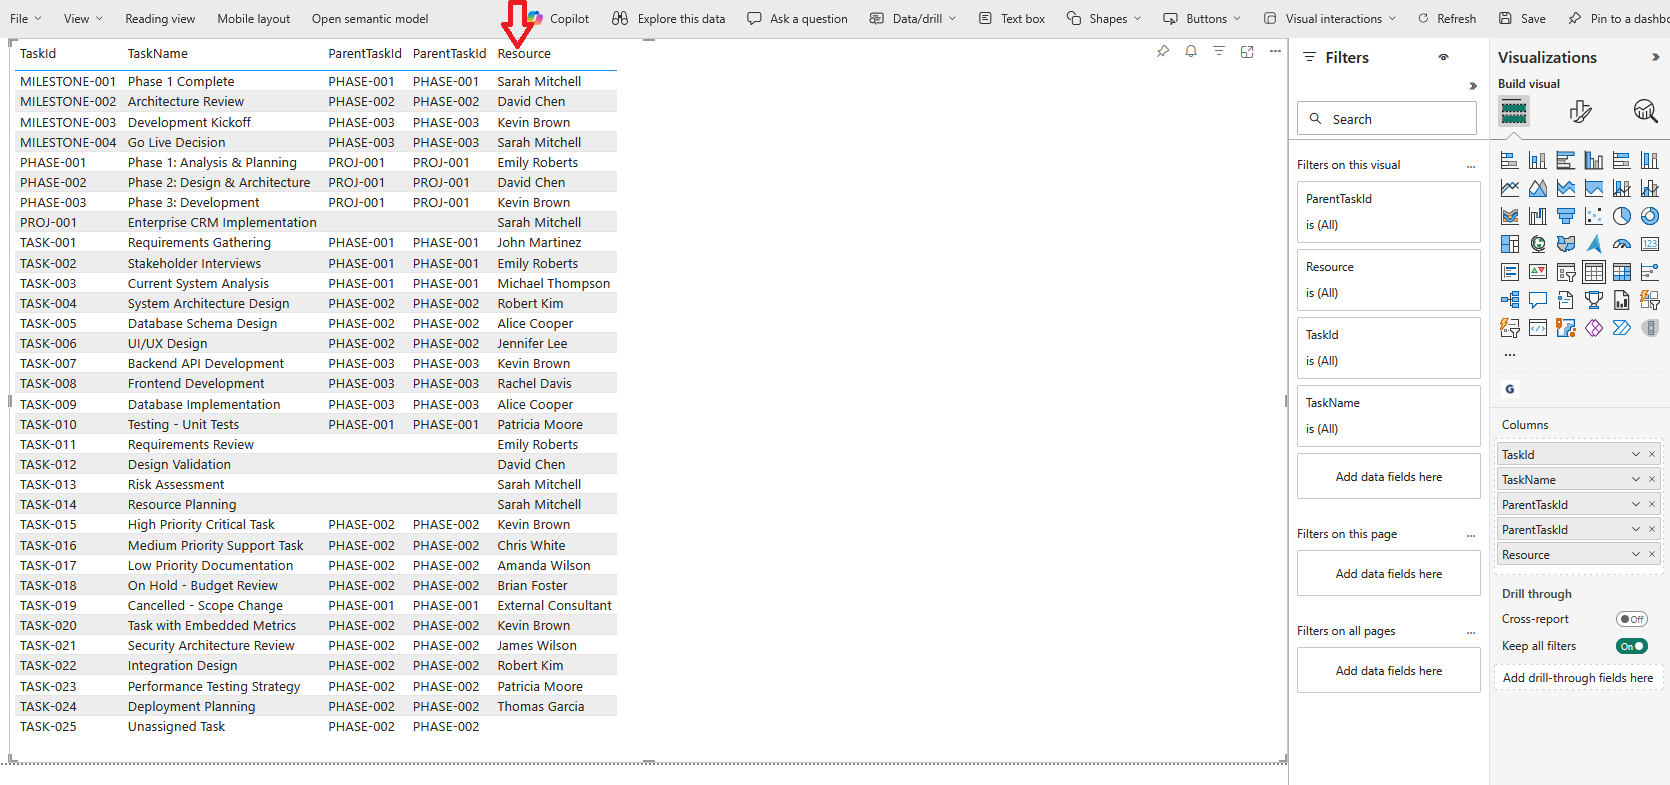
Resource
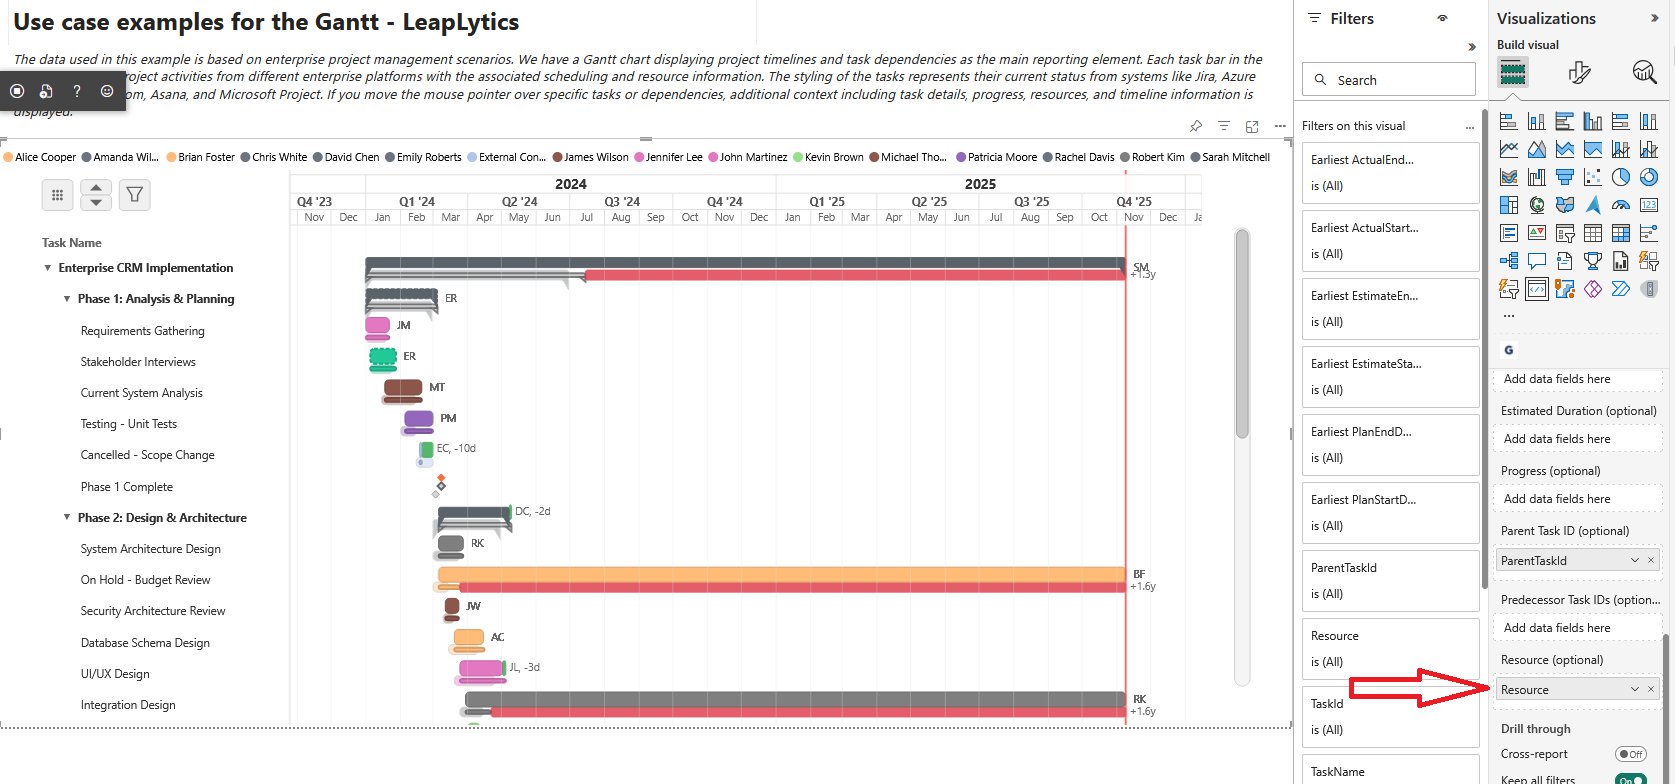
The Resource field allows you to assign one or multiple people, teams, or roles to a task. By providing a name—or a comma-separated list for multiple resources—the Gantt Chart clearly shows who is responsible for each activity. This helps teams understand workload distribution, identify potential bottlenecks, and improve coordination across parallel tasks. Resource assignments are displayed directly alongside the timeline for immediate clarity.
    'John Smith, Jane Doe'    AS Resource,            -- Comma-separated for multiple
  -- ===== NOTES =====
  -- • Multiple resources: comma-separate values in single field
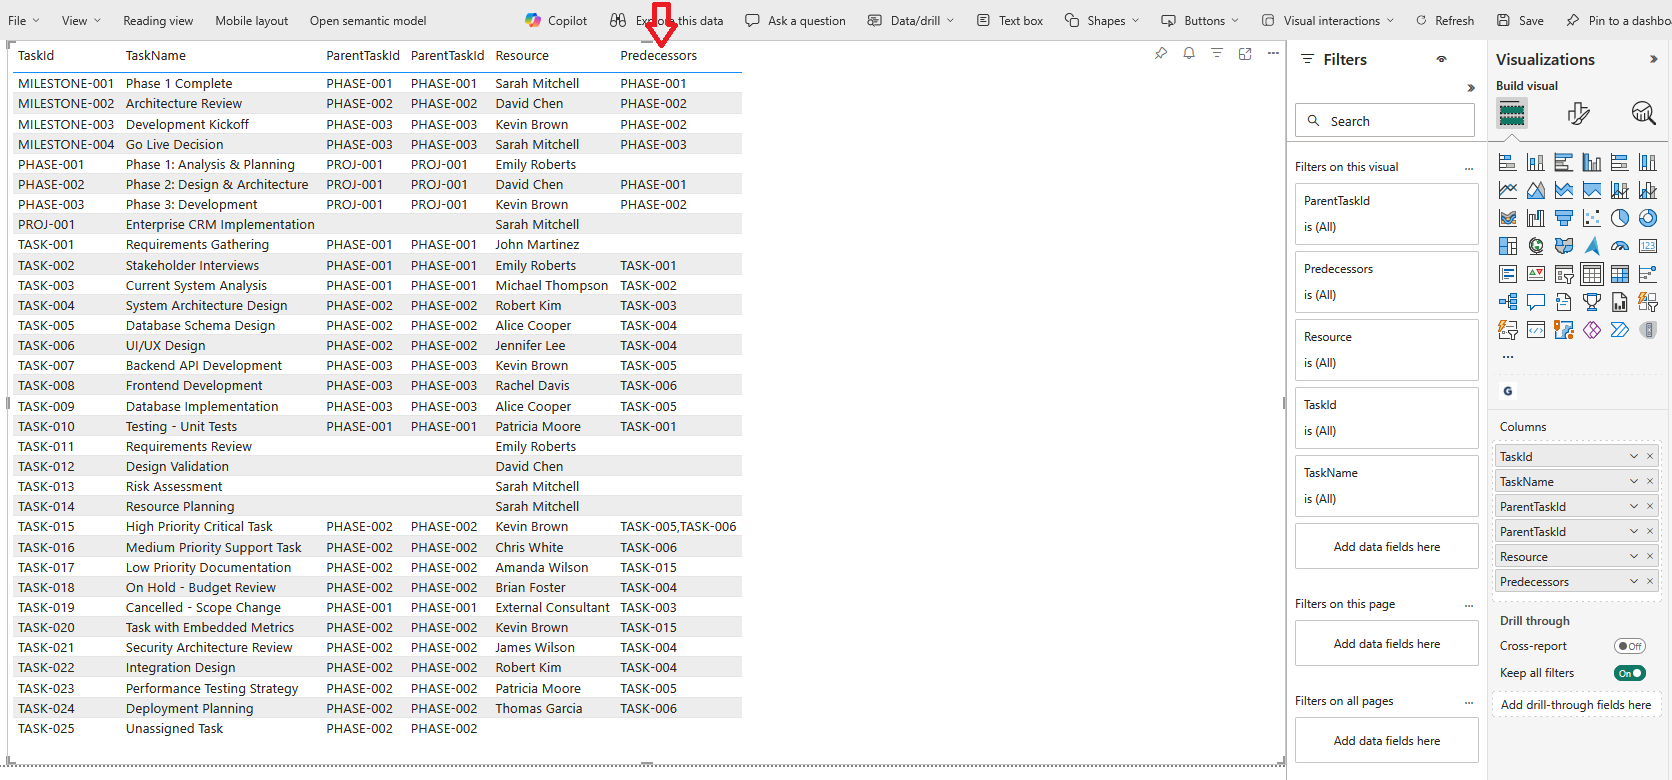
Predecessors
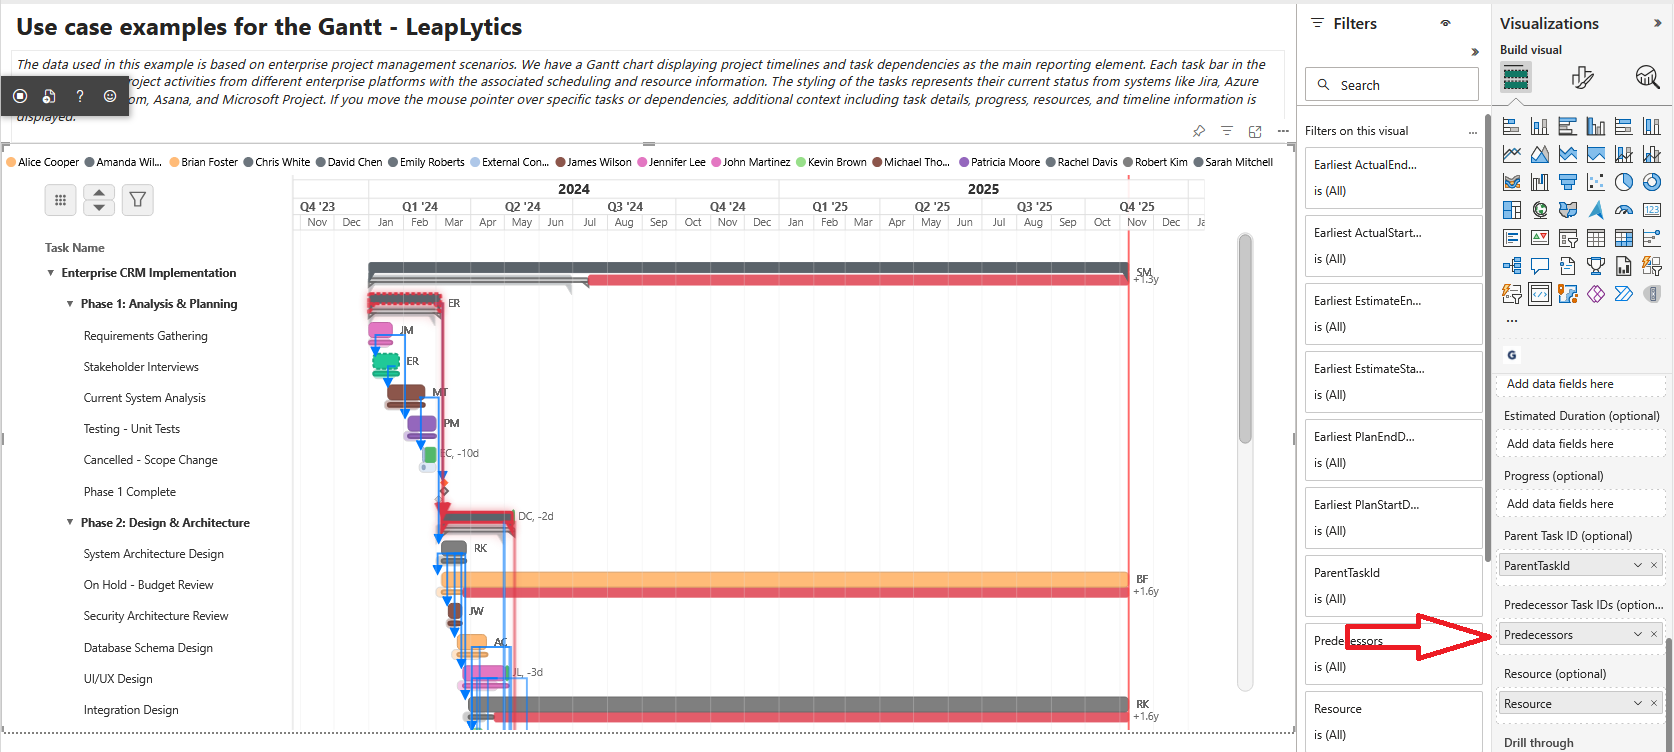
The Predecessors field defines task dependencies by listing one or more preceding Task IDs. By providing a comma-separated list of predecessor tasks, the Gantt Chart automatically draws finish-to-start dependency lines, making the logical flow of your project clearly visible. This helps teams understand sequencing, identify delays, and maintain a realistic, connected project schedule.
    'TASK-005, TASK-007'      AS Predecessors         -- Comma-separated predecessor IDs
  -- ===== NOTES =====
  -- • Predecessors: comma-separate task IDs for finish-to-start dependencies
Zoom & Pan
You can easily navigate the timeline using built-in zoom and pan controls. Hold ALT and use the mouse wheel to zoom in or out, or use a two-finger pinch gesture on mobile devices. To pan, hold the left mouse button and drag the chart left or right, or simply place your finger on the screen and move it to explore the timeline on mobile. The visual supports everything from a minute-by-minute view of a single day to a high-level project view spanning over 10 years.
Troubleshooting
Cross-filtering Problems
Selection not working with other visuals:
- ✅ Verify categorical data mapping is correctly configured
- ✅ Check PowerBI cross-filtering settings for the visual
- ✅ Ensure TaskID field is used consistently across all visuals
- ✅ Test selection functionality with simplified report
Highlighting not responding:
- ✅ Check highlight data structure in categorical mapping
- ✅ Verify PowerBI selection manager integration
- ✅ Test with PowerBI table visual to confirm cross-filtering works
- ✅ Review selection ID generation for task data
Data Mapping Problems
Fields not recognized:
- ✅ Check field data types match expected formats (dates, numbers, text)
- ✅ Verify field mapping in Data pane matches column names
- ✅ Ensure calculated columns are properly defined in data model
- ✅ Test with simple dataset to isolate field mapping issues
Progress/status not displaying:
- ✅ Verify Progress field contains numeric values between 0-100
- ✅ Check Status field contains expected status values
- ✅ Ensure progress bars are enabled in format panel
- ✅ Test with sample data containing various progress values
Hierarchical Structure Issues
Parent-child relationships not working:
- ✅ Verify ParentTask field contains valid TaskIDs for parent tasks
- ✅ Check for circular parent-child references
- ✅ Ensure hierarchy levels don’t exceed reasonable limits
- ✅ Test expand/collapse functionality with simple hierarchy
Rollup calculations incorrect:
- ✅ Check rollup configuration in format panel settings
- ✅ Verify child task data is complete and accurate
- ✅ Test rollup logic with known test cases
- ✅ Review date calculation logic for parent task spans
Advanced Best Practices
- Data Quality: Validate all dates, ensure TaskIDs are unique, check dependency references
- Performance Optimization: Limit dataset size, use appropriate data types, optimize DAX calculations
- Hierarchy Design: Plan logical parent-child relationships, avoid deep nesting, maintain clear structure
- Dependency Modeling: Map realistic dependencies, avoid circular references, use appropriate lag times
- Testing Strategy: Test with sample data, validate all features, performance test with large datasets
Visual Configuration Best Practices ✨
- Timeline Scaling: Choose appropriate default zoom level, configure reasonable date ranges, enable adaptive scaling
- Color Strategy: Use consistent color schemes, map colors to meaningful data attributes, ensure accessibility compliance
- Layout Optimization: Configure appropriate task bar heights, optimize text positioning, balance information density
- Interactive Design: Enable intuitive navigation, provide clear visual feedback, support both mouse and touch interaction
Supported Data Sources Reference
| Data Source | Platform | Status | Key Fields | Integration Notes |
|---|---|---|---|---|
| Microsoft Project | MS Project | ✅ Primary | Task ID, Name, Start, Finish, Dependencies | Export as Excel or connect via Project Online |
| Primavera P6 | Oracle | ✅ Primary | Activity ID, Name, Start, Finish, Predecessors | Export as Excel or XML import |
| Azure DevOps | Microsoft | ✅ Primary | Work Item ID, Title, Start Date, Target Date | Direct API connection or export |
| Jira | Atlassian | ✅ Primary | Issue Key, Summary, Due Date, Links | Export or API integration |
| Excel/CSV | General | ✅ Primary | Custom fields mapped to Gantt requirements | Direct PowerBI import |
| Asana | Asana | ✅ Secondary | Task ID, Name, Start Date, Due Date | Export as CSV |
| Custom Tables | Database | ✅ Secondary | User-defined schema matching Gantt model | Direct database connection |
This comprehensive visual transforms complex project data into beautiful, interactive Gantt charts that maintain professional quality and support sophisticated project management workflows directly in PowerBI dashboards. Your stakeholders will finally see project timelines the way they should be displayed – clear, interactive, and professionally formatted.