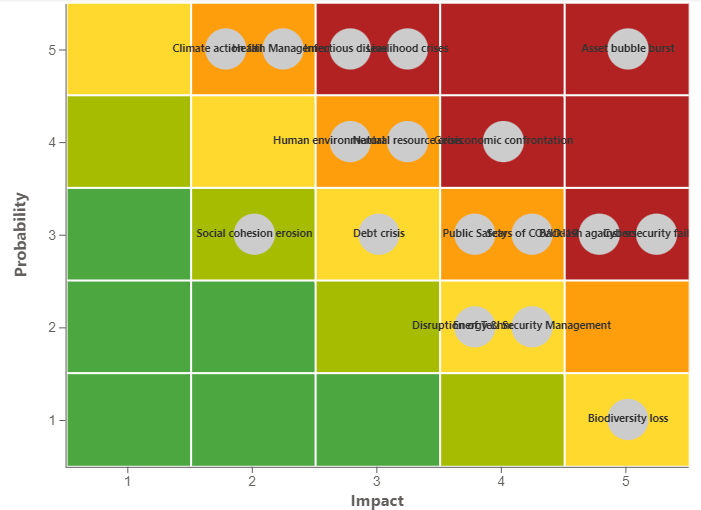
The texts of the risks are long and overlap in the visualization? We have collected some solutions for you.
Limitation of the number of characters
Furthermore, it is possible to limit the number of characters in a dimension or column. This allows you to individually define the length of the string so that the risk is still readable.
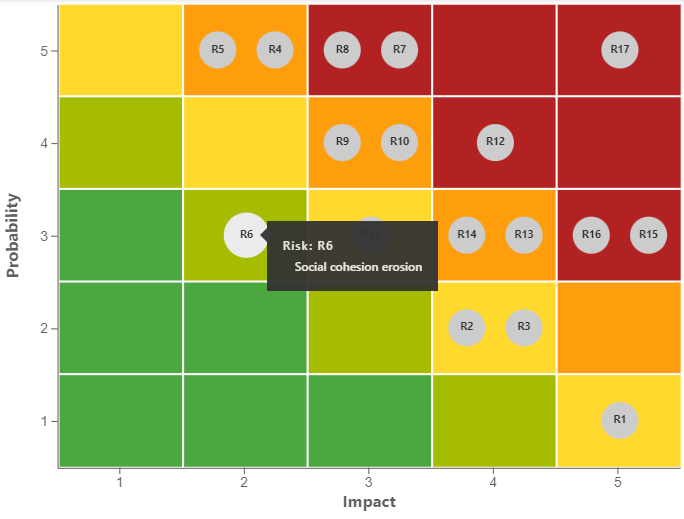
Here we have limited the description of the risk to the first eight characters and then added three dots for nicer readability. You can still see the detailed description by mouseover.
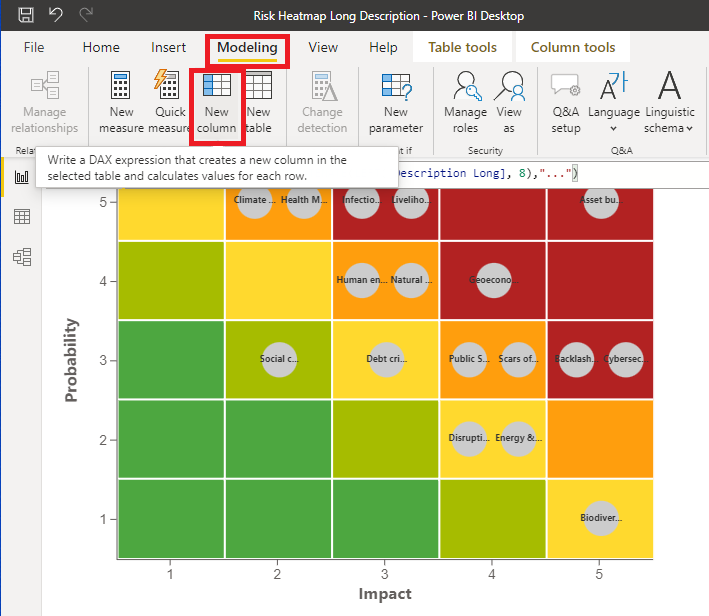
To do this, we first click on the “Modeling” tab in Power BI and then click on “New Column”.
The DAX Editor opens.
In our example, the “Description Long” column contains the text we want to shorten. You need to adjust the code accordingly to its description. Here we now insert the following code in this example:
Description Short = CONCATENATE(LEFT([Description Long], 8),"...")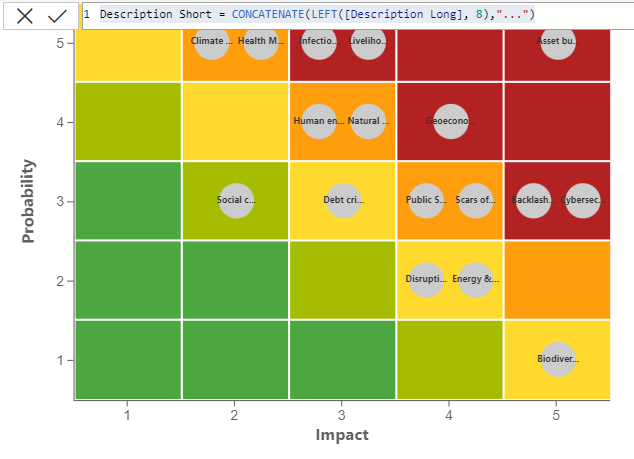
The inner function LEFT truncates the dimension to the first eight letters from the beginning. By the function CONCATENATE the shortened string and the three point ‘…’ are connected.
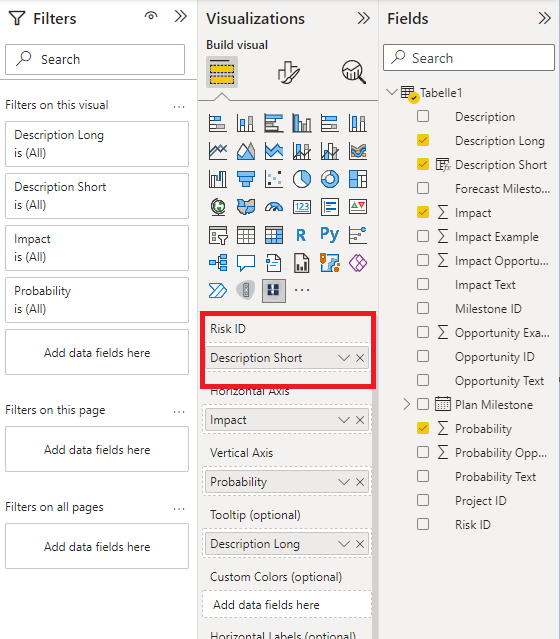
We now use the “Description Short” column and assign it to the “Risk ID” field of the visualization.
Use of the system-internal Risk ID
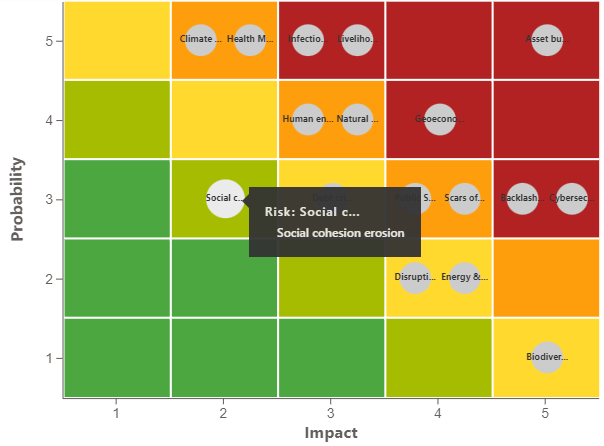
Let’s assume you have loaded your risks into the “Risk ID” field. Now the texts overlap. A first possibility is to use an internal ID – if possible – of the system’s risk instead of the longer description of the risk. This often has less characters.
Instead of the longer description, the ID is used here. This reduces the number of characters and makes it clearer. The description of the risk can now be displayed by a mouseover over the bubble.
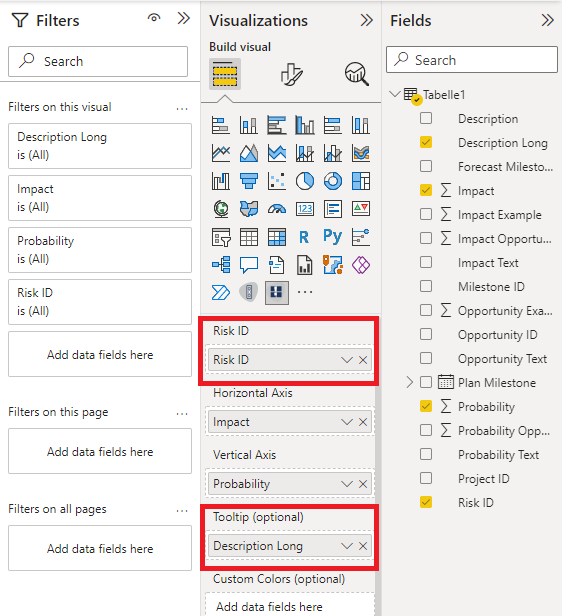
To do this, move the column or dimension with the longer text to the “Tooltip (optional)” field and the risk identifier from the system to the “Risk ID” field.
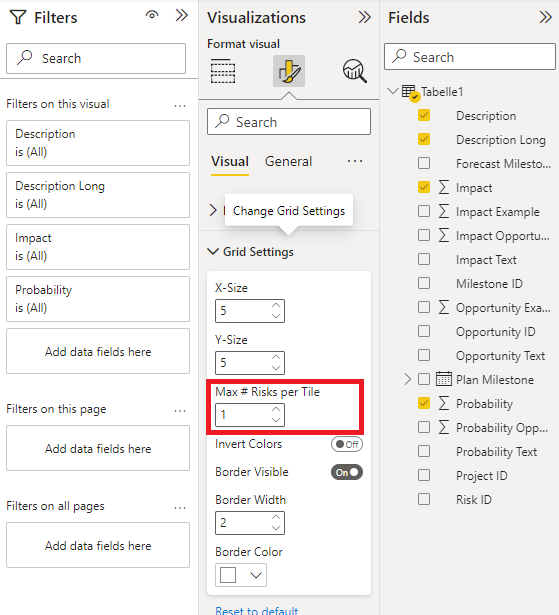
Minimize number of displayed risks per tile
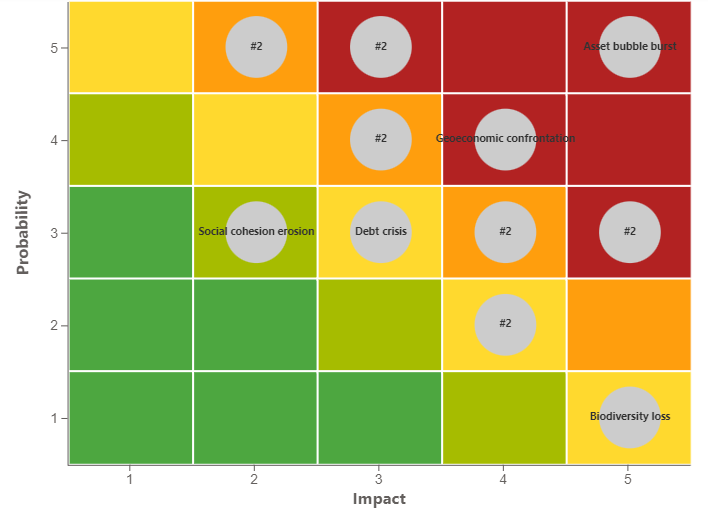
Another option would be to minimize the number of risks displayed. We originally implemented this to allow the user to lower the number of risks per tile. Anything above that will be displayed as a sum of risks with the diamond in front.
In this example, we have set the number of displayed risks to the value 1. So if more than one risk is assigned to the tile here, a sum is formed and displayed.