
Introduction
In aviation, cruise, and transport,hazard identification and risk management are crucial. Our Risk Matrix in Power BI emerges as a valuable tool for this purpose.
The tool excels at identifying hazards and simplifying data presentation for quick recognition. This capability allows for immediate action, enhancing safety in operations.
Navigating Aviation Hazards
In aviation, common hazards include runway issues or bird strikes. KPIs include the frequency of near misses and the effectiveness of safety training. For instance, communication system reliability is crucial.
Ensuring Safety in Cruise Operations
For cruises, hazards may involve ship collisions or health emergencies. KPIs include tracking response times to emergencies and adequate medical supplies. Hence, ensuring passenger safety is key.
Securing Transportation Operations
In the transport sector, hazards might include accidents or supply chain disruptions. KPIs are accident rates, maintenance schedule adherence, and the efficiency of contingency plans. For example, tracking the effectiveness of driver training programs is fundamental.
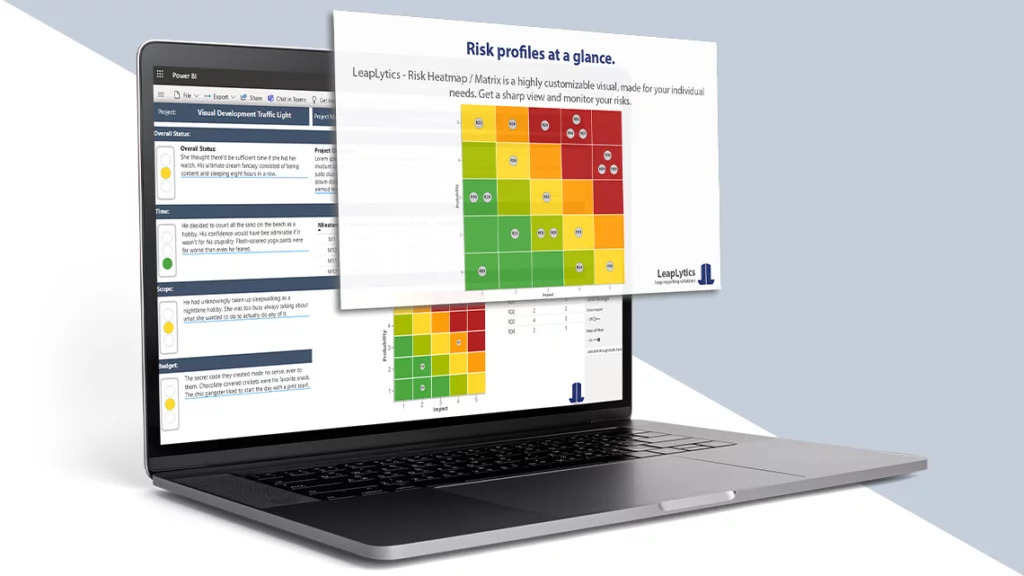
Risk Matrix for Power BI
Here is how the Risk Matrix refines your risk management:
Likelihood Axis: This axis looks at how likely a risk is to happen, from low to high. It helps understand the probability of potential risks to occur in these sectors.
Impact Axis: This axis looks at how severe a risk might be, categorized as low, medium, or high. It helps organizations in aviation, cruise, and transportation analyze how much harm a risk could cause.
Combining the likelihood and impact gives each risk a score. This helps rank risks based on how severe they are. Managing high-priority risks early minimizes threats and disruptions to operations.
With the Risk Matrix, organizations in these sectors can:
- Create Dashboards: Make real-time dashboards showing safety metrics, incidents, and trends. This makes it easy for risk managers to see how safety is going.
- Visualize Risk Data: Use charts and graphs to show risk scores from the Risk Matrix. This helps to understand how serious the identified risks are.
- Monitoring: Use Power BI to check if you meet safety regulations. Also find areas needing more safety measures in aviation, cruise, and transportation.
- Identify Trends: Take a look at your risk data. With the Risk Matrix you can understand the reasons for accidents, and recognize ongoing safety issues. This enables informed decisions-making for continuous safety improvement.
Conclusion
The Risk Matrix for Power BI gives valuable insights into risk landscapes. It helps focus on resources and improve safety. The tool empowers professionals to make informed decisions and handle their risks.
The Risk Matrix is a significant asset for aviation, cruise, and transport industries. Making risk identification and management more accessible and efficient. By doing so, companies can maintain safe and smooth operations in these vital sectors.