How to prepare your data
Our Risk Matrix requires whole numbers in the range 1 to up to 10 for the two possible dimensions.
If this is not the case in your data, we have created a subpage with instructions for transforming strings and other numerical values.
Download Visual
Loading data & License

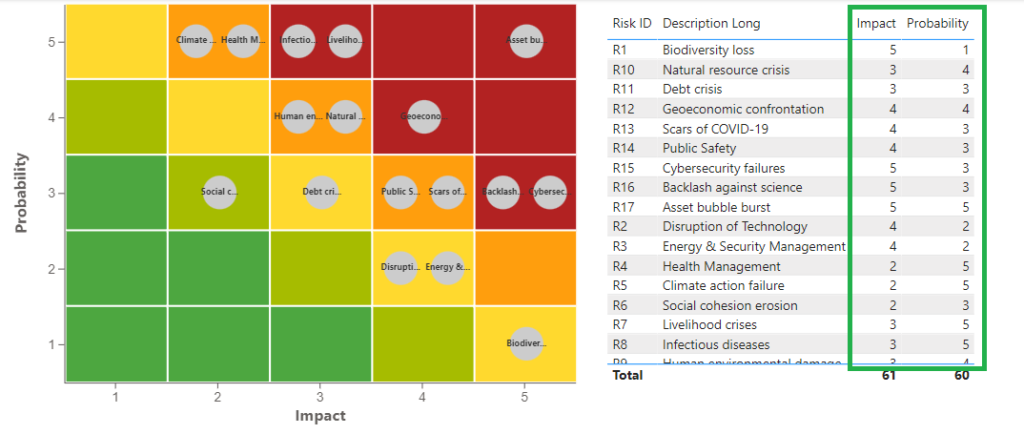
After you have prepared your data and converted the expression of the risks into the value range 1 to 10, you can now link the data with the visualization.
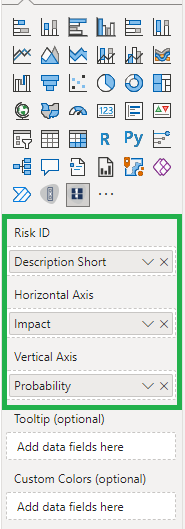
Initially, three fields are required:
- Risk ID (The labeling that your risk gets on the matrix)
- Horizontal Axis (The dimension to be plotted on the horizontal axis)
- Vertical Axis (Vertical dimension)
Avoid “Count”, “Count (distinct)”, “Standard deviation”, “Variance” and “Median” aggregations for the axes, since these only generate a total key figure!
Custom Colors
On Windows, simply hold the ALT key and left-click on a tile. Once you do that, the color editing mode will appear.
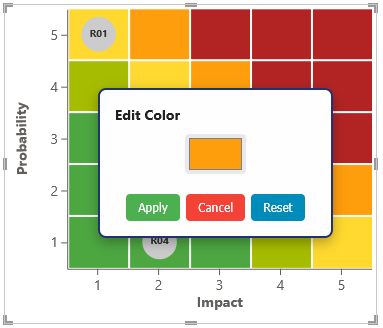
Click on the colored rectangle and choose your preferred color. After selecting it, click “Apply.”
Grid Settings
Axis Settings
Indicator Settings
Conditional Formatting
Tooltips
Drillthrough
History or Inherent/Residual risk
Now you are ready to use our Risk Heatmap and enhance your reporting! Below we have listed more in-depth instructions for all further customizations: