Most companies treat risk management like a carnival game. They create pretty heatmaps that show red, yellow, and green squares. Then they hang them on walls and call it strategy. Here’s the problem: heatmaps tell you what’s broken. They don’t tell you what to fix first. We’ve seen organizations spend months analyzing risks, only to …
Blog
Power BI and Risk Management in 2025 – Trends
Risk management in 2025 isn’t what it was five years ago. Organizations that stick with old methods get blindsided. Those that adapt with modern tools like Power BI stay ahead. We’ve seen companies lose millions because they couldn’t see risks coming. The difference? The winners use data visualization and real-time analytics to spot problems before …
From Data to Foresight: Using Power BI for Smarter Risk Management
Risk management without data is guesswork. And guesswork kills projects. We’ve watched companies burn millions because they couldn’t see problems coming. The warning signs were there. The data existed. But nobody connected the dots until it was too late. Power BI changes this game. It turns your scattered risk data into a crystal ball for …
Quantified Risk Framework in Power BI: Uncertainty Propagation, Trust Scores & Governance-as-Code
Most risk frameworks are broken. They rely only on color-coded matrices and gut feelings while your business burns through millions in failed projects. We’ve built risk systems for Fortune 500 companies and seen the same pattern: teams create beautiful dashboards that look impressive but can’t answer the one question that matters – “What’s the real …
Why our Risk Matrix is the Solution for your Needs
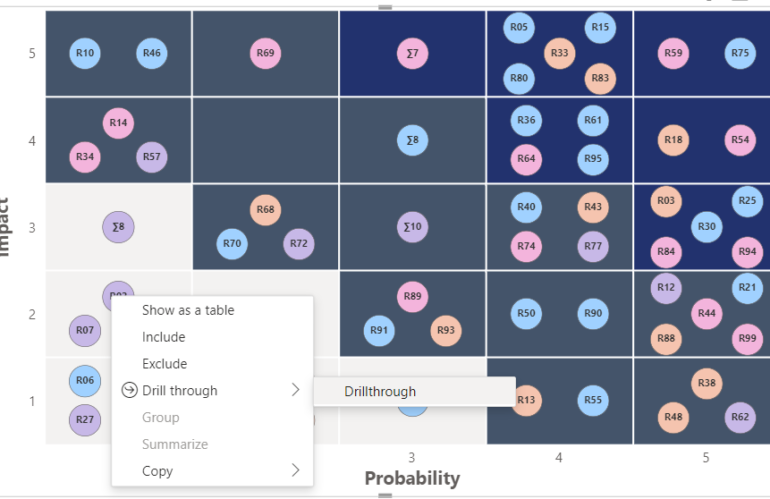
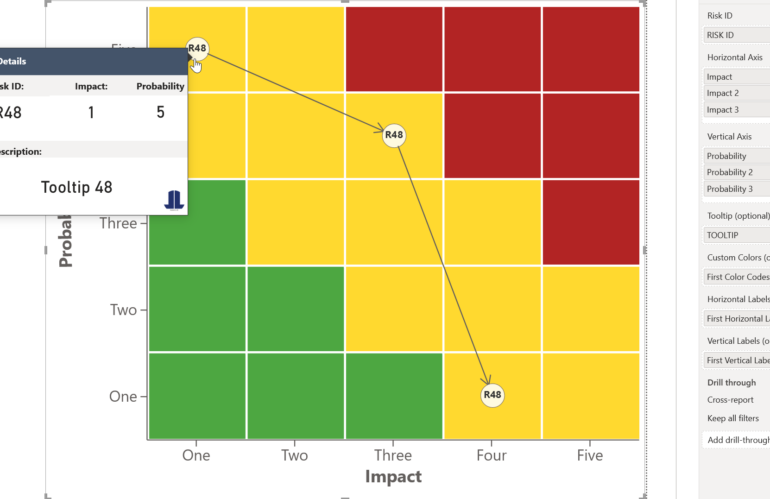
We are not aiming to lecture or dictate. Rather, we have created a visual that is oriented towards the problems of risk and project managers. According to our clients’ needs we have developed the Risk Matrix including its extensive features. Core Features Customizability: Create your individual Risk Matrix by adapting grid, axis, and indicator settings …
OSHA Risk Matrix in Power BI
Workplace safety is of paramount importance for any organization, as it directly affects the well-being of employees and the overall productivity of the business. In this blog post, we will explore how three powerful tools – OSHA (Occupational Safety and Health Administration), risk matrix, and Power BI – can work together to create a safer …
Supplier Quality Assurance / Management with Power BI
Are you tired of poor supplier quality affecting your business’s success? The performance of your suppliers is crucial to the success of the business and can significantly impact the quality of the final product or service. To ensure that suppliers meet necessary standards, it is essential to monitor the quality of the goods and services …
Microsoft Dynamics 365 Project Operations Risk Management
In a new video, Ludwig Reinhard, a Dynamics 365FO/AX consultant from Germany, demonstrates how to enhance Microsoft Project Operations with a better visualization of risks. To do so, he uses our Power BI Risk Matrix visual. In the video, Ludwig shows seven steps that are required to integrate the risk heatmap with Project Operations. First, …
ESG Risk Matrix with Microsoft Power BI
A risk matrix is a tool used to assess and evaluate the risks associated with a particular business operation or venture. It allows companies to identify potential risks and take appropriate action to prevent or mitigate those risks. One area where a risk matrix can be particularly beneficial is in supporting environmental, social, and governance …
Power BI Custom Visuals – What you need to know!
In this article, we’ll go over what a Custom Visual is, where you can then download them and how you can build an additional visualization for Power BI yourself. What is a custom visual? A Custom Visual is a visualization for Power BI that is not included in the standard Microsoft Power BI package. Power …


