Are you tired of poor supplier quality affecting your business’s success? The performance of your suppliers is crucial to the success of the business and can significantly impact the quality of the final product or service. To ensure that suppliers meet necessary standards, it is essential to monitor the quality of the goods and services they provide. In this blog post, we will explore how Power BI can be used to analyze supplier quality.
Power BI is a robust data visualization tool that allows businesses to analyze large amounts of data and derive insights to aid in informed decision-making. With Power BI, businesses can create interactive dashboards that provide a comprehensive view of supplier performance metrics, such as quality, delivery, and cost.
To conduct supplier quality analysis using Power BI, follow these steps:
Step 1: Gather Supplier Data
The first step in supplier quality analysis is to collect data on supplier performance. This includes information on delivery times, lead times, defect rates, and other quality-related metrics. Data can be collected from various sources, such as ERP systems, quality control databases, and supplier scorecards.
Step 2: Import Data into Power BI
After collecting data, it can be imported into Power BI. This tool supports a variety of data sources, such as Excel spreadsheets, CSV files, and SQL databases. Once imported, the data can be cleaned and transformed using Power BI’s data modeling capabilities.
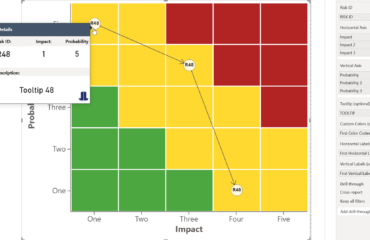
Step 3: Create Dashboards and Reports
Next, create dashboards and reports. Power BI provides numerous visualization tools for creating custom dashboards and reports. Dashboards can include charts, graphs, and tables that present a comprehensive view of supplier performance metrics.
Step 4: Analyze Supplier Performance
With dashboards and reports in place, begin analyzing supplier performance. This may involve comparing supplier performance metrics against industry benchmarks, identifying trends over time, and determining areas for improvement. Power BI’s data analysis tools can help quickly identify performance gaps and take corrective action.
Step 5: Collaborate and Share Insights
Finally, collaborate with suppliers to improve performance by sharing insights. Power BI provides various sharing and collaboration features that allow businesses to share dashboards and reports with suppliers and work together to improve performance.
In conclusion, Power BI is a robust tool for supplier quality analysis. Businesses can use Power BI to collect and analyze supplier performance data, identify areas for improvement, and collaborate with suppliers to enhance performance. With Power BI’s data visualization and analysis capabilities, businesses can make informed decisions and drive business success.