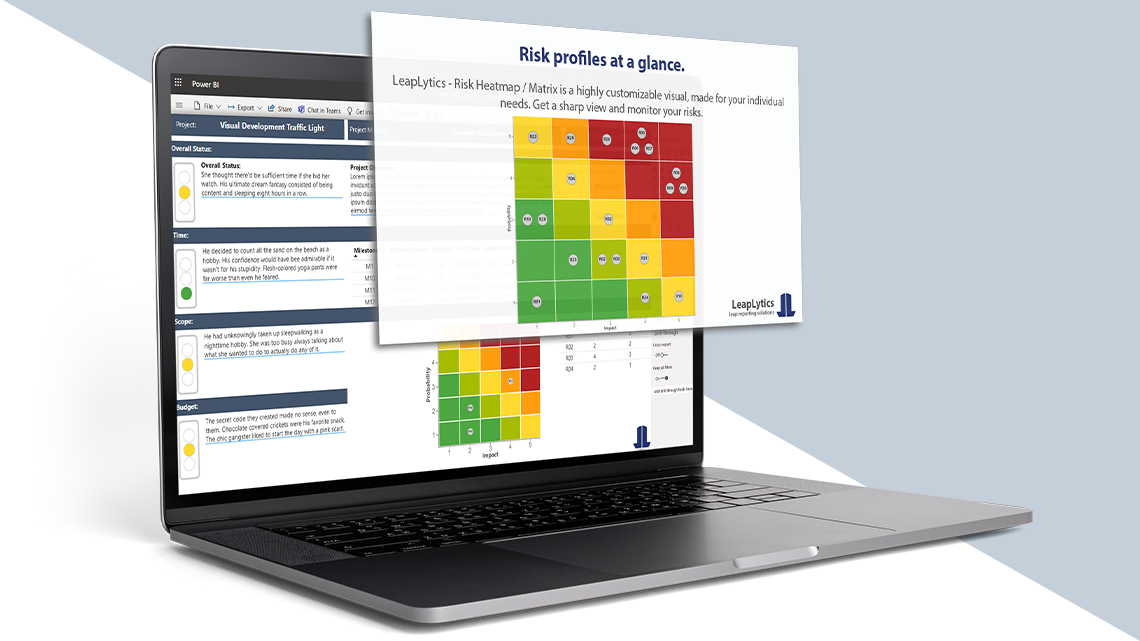
In a new video, Ludwig Reinhard, a Dynamics 365FO/AX consultant from Germany, demonstrates how to enhance Microsoft Project Operations with a better visualization of risks. To do so, he uses our Power BI Risk Matrix visual.
In the video, Ludwig shows seven steps that are required to integrate the risk heatmap with Project Operations. First, he adds new fields to the Dataverse Risk table and creates a series of risks to be evaluated. He then opens the PP solution and adds a new navigation element.
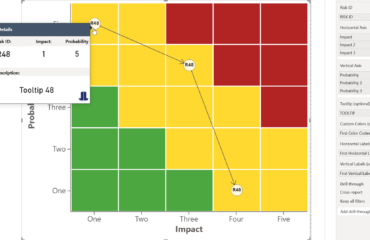
The core of the video is about how to connect data and design the risk matrix in Power BI Desktop and then pin it to the Project Operations dashboard. The result is a graphical risk card that makes it easier for Project Operations users to identify and evaluate risks immediately.
“Our heatmap is a powerful visual representation of risks based on Power BI.” explains Dominik Galsheimer, Managing Director of LeapLytics GmbH. “By integrating it into Microsoft Project Operations, companies can better understand and manage the risks associated with their projects. We are thrilled that Ludwig Reinhard has featured our heatmap in his video and hope that it helps other companies manage their risks more effectively.”
You can watch Ludwig Reinhard’s video on his website here. For more information about LeapLytics’ Risk Matrix, please visit our product page here.
Don’t miss out on the chance to enhance your Project Operations workflow with a more robust risk visualization. With LeapLytics’ Risk Matrix and Ludwig Reinhard’s expert guidance, you can take your risk management to the next level.
Watch the video and see for yourself how easy it can be to create risk cards in Microsoft Project Operations using Power BI!