The Risk Heatmap is now available in the official Qlik Sense Garden Branch! A heatmap is a vital part of a project status reporting and with that of a solid and usefull project management approach.
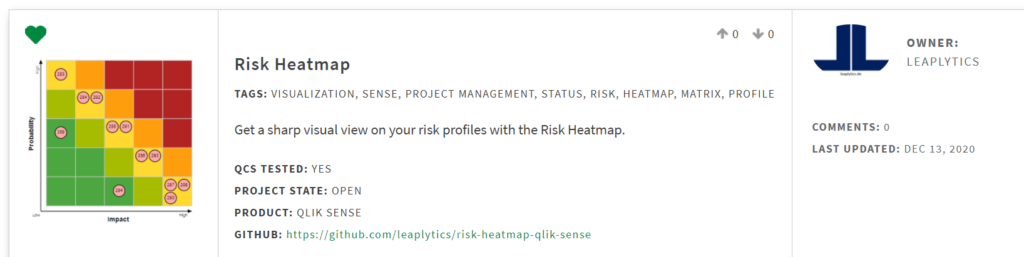
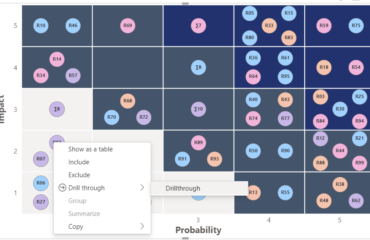
You can use the heatmap in order to get a sharp visual view on your risk profiles. This extension is built to visualize profiles, that are measured in a matrix of two KPIs and different categories. It is able to visualize multiple indicators (up to 4 in free version) per field. Various settings like an easy switch between a 3×3- and 5×5-field-matrix, border and text settings adapts this extension to your reporting needs.
Find more details in our documentation and download the extension in Qlik Garden Branch.
The Heatmap is the second extension of our project management suite for QlikSense. More useful extensions like Milestone-View or project-maturity-state will follow.
Björn Lange – LeapLytics
You can subscribe for fresh information and release updates via our subscription formular.
About LeapLytics
With our extensions, we incorporate your individual solutions. Use the different possibilities to enhance your dashboard and to implement your ideas. The extensions follow a clear structure and are build with the focus to the user in order to make it as inituitive as possible without giving up important funcionality. Therefore, a comprehensive documentation with detailed description of possible use cases accelerate the use and implementation.