Workplace safety is of paramount importance for any organization, as it directly affects the well-being of employees and the overall productivity of the business. In this blog post, we will explore how three powerful tools – OSHA (Occupational Safety and Health Administration), risk matrix, and Power BI – can work together to create a safer and more secure working environment while effectively managing risks and improving decision-making.
→ Check out our Custom Visual ‘Risk Matrix’ for Power BI here!
OSHA, the federal agency under the Department of Labor, is dedicated to safeguarding workers from potential hazards and promoting workplace safety. OSHA sets and enforces safety standards, conducts inspections, and offers outreach programs to educate employers and employees about workplace safety measures.
Compliance with OSHA regulations is critical for organizations, as it not only protects employees from accidents and injuries but also helps companies avoid costly penalties and legal consequences. By prioritizing safety and adhering to OSHA guidelines, businesses foster a culture of safety and well-being, leading to increased employee satisfaction and productivity.
The risk matrix is a valuable tool in risk management that visually assesses the likelihood and impact of potential risks. By plotting risks on a matrix, organizations can quickly identify high-priority risks and allocate resources for appropriate mitigation strategies.
Here’s how the risk matrix works:
- Likelihood Axis: This axis evaluates the probability of a risk event occurring, ranging from low to high. It helps in understanding the chances of specific risks materializing.
- Impact Axis: This axis gauges the potential consequences or severity of a risk event, typically categorized as low, medium, or high. Assessing the impact helps organizations understand the potential harm caused by a risk.
By combining the likelihood and impact, each risk is assigned a risk score, which aids in prioritizing risks based on their severity. Proactive identification and mitigation of high-priority risks enable organizations to minimize potential threats and disruptions to operations.
Power BI, a powerful business analytics service by Microsoft, complements OSHA and the risk matrix by providing data-driven insights and visualizations. It connects to various data sources, including OSHA recordkeeping data, to help organizations analyze and understand safety trends and patterns.
With Power BI, organizations can:
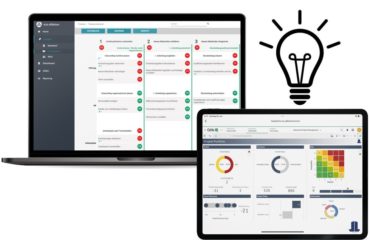
- Create Interactive Dashboards: Generate real-time and interactive dashboards that display safety-related metrics, incidents, and trends, making it easier for management to track safety performance.
- Visualize Risk Data: Use a wide range of customizable charts and graphs to visualize risk scores from the risk matrix, helping stakeholders comprehend the significance of identified risks at a glance.
- Monitor Compliance: Utilize Power BI to monitor compliance with OSHA regulations and identify areas where additional safety measures are necessary.
- Identify Safety Trends: By analyzing historical safety data, organizations can identify trends, root causes of accidents, and recurring safety issues, enabling informed decision-making for continuous improvement.
→ Check out our Custom Visual ‘Risk Matrix’ for Power BI here!
Conclusion
The combination of OSHA, the risk matrix, and Power BI presents a powerful synergy that drives workplace safety and risk management to new heights. By complying with OSHA guidelines, organizations demonstrate their commitment to employee welfare and regulatory compliance. The risk matrix enables systematic risk assessment and prioritization, enabling proactive risk mitigation. Power BI, with its data visualization and analysis capabilities, empowers organizations to make informed decisions, monitor safety performance, and promote a culture of safety.
As businesses embrace this trio of tools, they pave the way for a safer, more productive, and efficient work environment, fostering a workforce that feels valued, protected, and motivated to achieve success.
Remember, the success of this approach depends on continuous improvement and adaptability to changing conditions. By integrating these tools into the organization’s safety management framework, organizations can drive lasting positive change and ensure safety remains a top priority for years to come.