In this article, we’ll go over what a Custom Visual is, where you can then download them and how you can build an additional visualization for Power BI yourself.
What is a custom visual?
A Custom Visual is a visualization for Power BI that is not included in the standard Microsoft Power BI package. Power BI has a large community and many developers contribute to extend the standard tools.
Where can I find and how can I install a custom Power BI visualization?
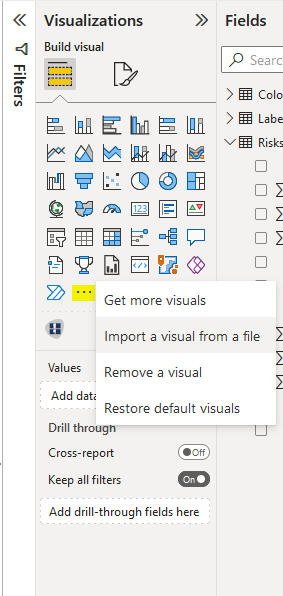
In Power BI Desktop, you can search for a custom visual directly by clicking on the three highlighted dots in the sidebar under “Visualizations”. Then select “Get more visuals”. This opens the AppSource from Microsoft, where you can select and download custom visuals. They will be added directly to your selection of visualizations in the report.
You can also navigate and search the AppSource (https://appsource.microsoft.com/de-de/) via the browser. If you download a visualization there, you can import it either on the Power BI web interface or in Power BI Desktop. This is done by “Import a visual from a file” instead of “Get more visuals” (see screenshot). You get a .pbiviz file package that contains a the data of the visualization.
What should I look for when choosing an advanced visualization?
Visualization with certification is recommended. Certified visualizations have been thoroughly checked by Microsoft and the source code has been analyzed. In these specially tested visuals, data leakage is not possible. In addition, these visualizations can be exported to PowerPoint slides and PDFs. A feature not to be neglected!
If new updates are released regularly this is also recommended. This ensures compatibility on a regular basis. It is also worthwhile to take a look at the ratings of the custom visuals. What do other users think about the visualization?
How do I create a custom visual in Power BI myself?

There are very many instructions on the Internet. Many blogposts refer to the beginner tutorial from Microsoft, in which a circle card is built. We also recommend this project as a starting point. When we started to develop our Traffic Light and Risk Heatmap / Matrix, we also learned a lot from this project.
Basic knowledge in object oriented programming is an advantage. You should know what a class is and what an object is. The visualizations or the interface was realized with Typescript. If you are familiar with Javascript, you will have no problems with Typescript.
Are Power BI custom visuals free?
There are many very good, free custom visuals for Power BI. Special visualizations have been developed for specific use cases that require high quality and reliability. Therefore, there are also custom visualizations that are available for purchase. However, this also assures reliability and support from the developers.