Case Study · Internal Audit & Security Governance · Insurance Industry
The Challenge: Risk Visibility Without a Single Source of Truth
For the Internal Audit and Security Strategy & Governance team at a mid-sized U.S. insurance group, risk reporting had become a bottleneck rather than a business enabler. Each audit cycle required analysts to manually consolidate risk data from multiple spreadsheets, shared drives, and legacy systems — a process that consumed up to two full working days per reporting period. The resulting outputs were static, difficult to update, and almost impossible to present in a way that allowed senior stakeholders to quickly identify where the most critical risks were concentrated. In an industry where regulatory scrutiny and cyber risk exposure are intensifying, this gap between data availability and actionable insight was becoming untenable.
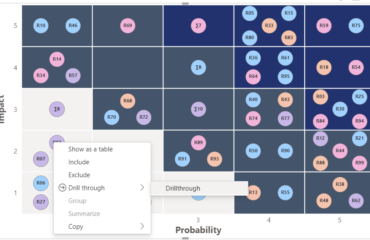
The team’s specific pain point was the absence of a dynamic, visual risk matrix that could map threats by likelihood and impact in real time — and update automatically as new data came in. Existing tools required manual re-entry after every data change, leading to version control issues and inconsistent risk scores across departments. With audit committee presentations scheduled quarterly and an increasing volume of operational, compliance, and cyber risks to track, the governance team needed a solution that could scale with their reporting demands without adding headcount.
The Solution: Power BI Risk Matrix by LeapLytics
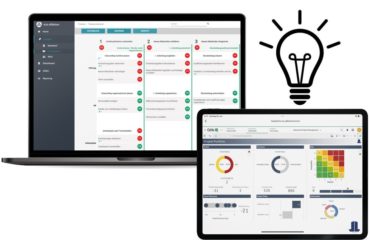
After evaluating several options, the team implemented the LeapLytics Risk Matrix for Power BI — a custom visual designed specifically for enterprise risk visualization within Microsoft’s Power BI ecosystem. The decision was driven by three key criteria: native integration with their existing Power BI environment, the ability to configure risk categories and scoring thresholds without custom development, and a visual output clear enough to be used directly in board-level presentations.
Implementation was led jointly by the internal audit team and the organization’s BI competency center. Within the first two weeks, the team connected the Risk Matrix visual to their existing risk register data — held in a combination of SharePoint lists and an internal SQL database — via Power BI’s standard data connectors. No data migration was required. Risk owners across business units were given read access to the live dashboard, while the governance team retained control over scoring logic and category definitions. The rollout required no external consultants and was completed without disruption to ongoing audit work.
Measurable Results: From Static Spreadsheets to Live Risk Intelligence
Within 90 days of full deployment, the governance team documented the following outcomes:
- 65% reduction in risk reporting cycle time — what previously took two days now takes under four hours per reporting period
- Single source of truth established across Internal Audit, Security, and Strategy & Governance — eliminating version conflicts across departments
- 100% of quarterly audit committee presentations now delivered directly from the live Power BI dashboard — no manual slide preparation required
- Risk coverage increased by 30% — with the time saved, the team was able to expand the number of tracked risk items from 48 to 63 without additional headcount
- Faster escalation of high-impact risks — critical risks now visible to senior stakeholders within 24 hours of identification, versus 5–7 business days under the previous process
- Improved cross-departmental alignment — consistent risk scoring methodology adopted across three previously siloed functions
What the Team Said
“We’d been talking about improving our risk visualization for years, but the effort always seemed disproportionate to the available tools. The LeapLytics Risk Matrix changed that — it plugged directly into what we already had in Power BI and gave us the kind of heat map view we’d been building manually in PowerPoint. The audit committee now spends less time asking ‘where is this data from’ and more time actually discussing the risks.”
— Director of Internal Audit & Security Governance, U.S. Insurance Group (anonymized)
What Other Organizations Can Learn From This Case
This case is not unique to the insurance industry. Any organization running Internal Audit, GRC, or Security Governance functions within a Power BI environment is likely facing a variation of the same challenge: risk data exists, but the infrastructure to visualize and communicate it in real time does not. According to KPMG’s Internal Audit Key Risk Areas 2024, internal audit functions must remain agile and report on emerging risks quickly — a standard that static spreadsheet-based reporting fundamentally cannot meet.
Three takeaways stand out from this deployment that apply broadly:
- Start with your existing data infrastructure. The most successful implementations don’t require a data migration. If your risk register is already in SharePoint, Excel, or a database that Power BI can connect to, you can have a live risk matrix running within days — not months.
- Visual clarity drives stakeholder engagement. A well-designed Power BI risk matrix does more than organize data — it changes how leadership interacts with risk information. When risks are plotted by likelihood and impact on a live heat map, conversations shift from reporting to decision-making.
- Governance teams don’t need to depend on IT. One of the underappreciated advantages of a custom Power BI visual is that risk owners can manage scoring, categories, and thresholds themselves — without raising a development ticket. This independence is critical for teams that need to move fast in response to emerging threats.
For organizations specifically in regulated industries — insurance, financial services, healthcare — the ability to demonstrate a structured, auditable, and consistently applied risk visualization process is increasingly a compliance expectation, not just a best practice. Tools like the LeapLytics Risk Matrix for Power BI make that standard achievable without enterprise-level implementation costs.
Industry: Insurance (U.S.) | Function: Internal Audit, Security, Strategy & Governance | Tool: LeapLytics Risk Matrix for Power BI | Timeline: 60 days to full deployment